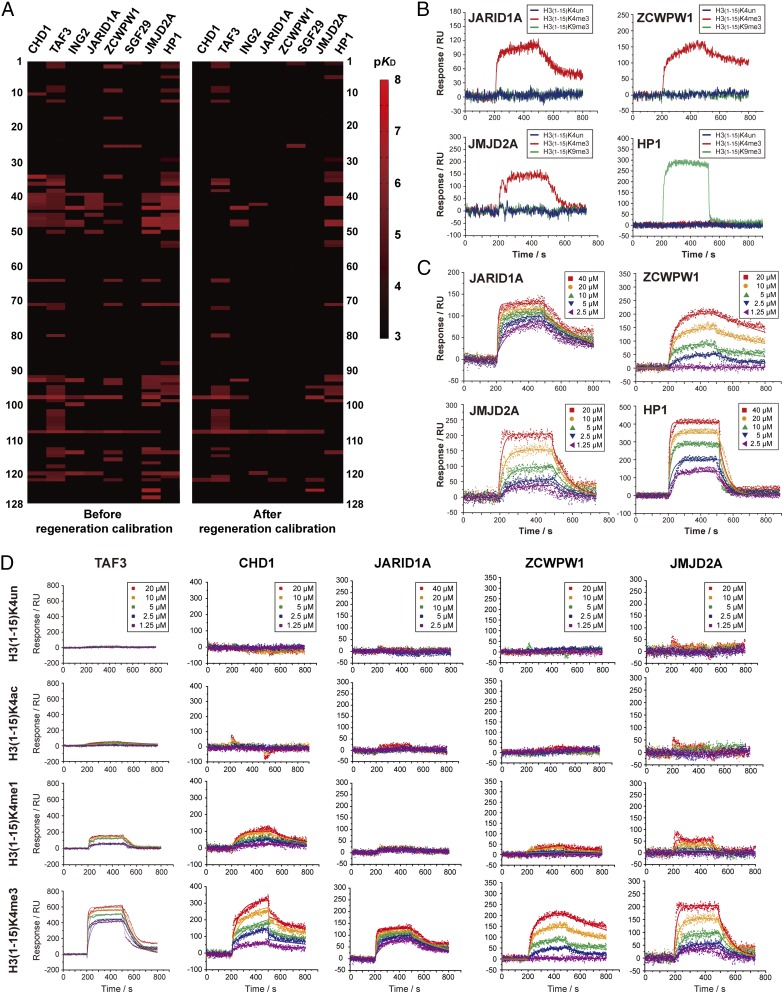
Fig. 4.
High-throughput kinetic analysis of 1,000 pairs of histone peptide–histone reader interaction. (A) Heatmaps of binding affinities between histone peptides and histone readers. The Left and Right panels are heatmaps before and after RC. The affinity values KD (in molar concentration) in various levels (10−3∼10−8 M) was transformed into −log10KD (3∼8) as pKD for comparison in the heatmap. The statistics of the heatmap is shown in SI Appendix, Table S3. (B) The SPRi curves of JARID1A, ZCWPW1, JMJD2A, and HP1. The binding curves to H3K4me3 are shown in red; the binding curves to H3K9me3 are shown in green; the binding curves to unmodified H3 are shown in blue. (C) The SPRi fitting curves of five gradients of protein concentration. All binding affinity values were determined according to three parallel experiments. (D) High-throughput kinetic SPRi curves of unmodified/modified H3(1–15)K4 peptides binding to TAF3, CHD1, JARID1A, ZCWPW1, and JMJD2A. All binding affinity values were determined according to three parallel experiments. The kinetic parameters of each binding pair are shown in SI Appendix, Table S6.

