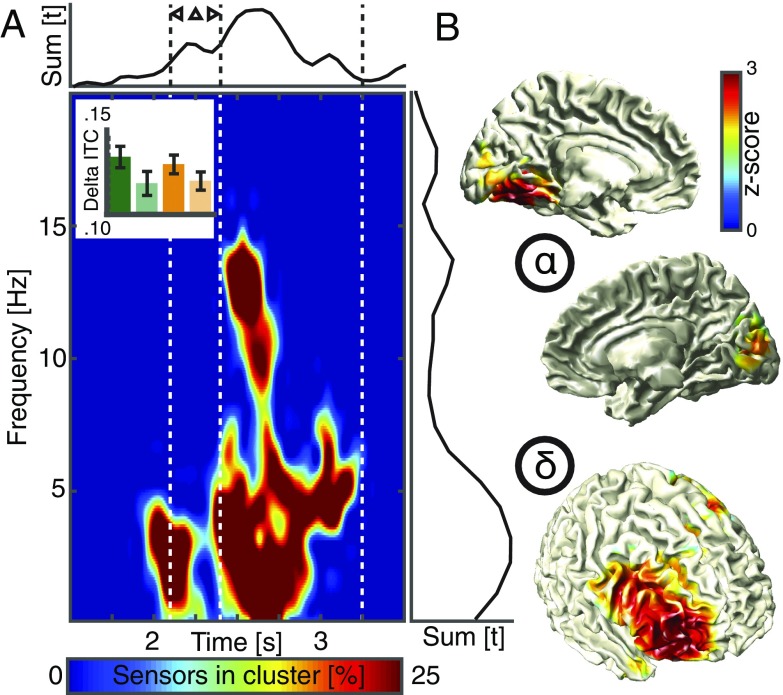
Fig. 3.
Spectral signatures and cortical sources. (A) A cluster-based permutation test comparing the intertrial coherence between predicted and nonpredicted contexts revealed a large cluster spanning several spatiotemporal scales. (Lower Left) The percentage of sensors that is part of the cluster at any given time and frequency point. (Upper Right) The sum of t values in the cluster across all significant time points (Right) or frequency points (Upper) across all sensors. The Inset depicts all four conditions (same conventions as in Figs. 1F and 2D) and highlights that only a main effect of prediction, but no interaction, was observed. (B) Statistical maps (masked at cluster-corrected P < 0.05) comparing the source reconstructed intertrial coherence values between predicted and nonpredicted contexts localized the low-frequency effect to the right middle frontal gyrus, while the effect in the alpha-band emerged from ventromedial parietoocciptal areas.

