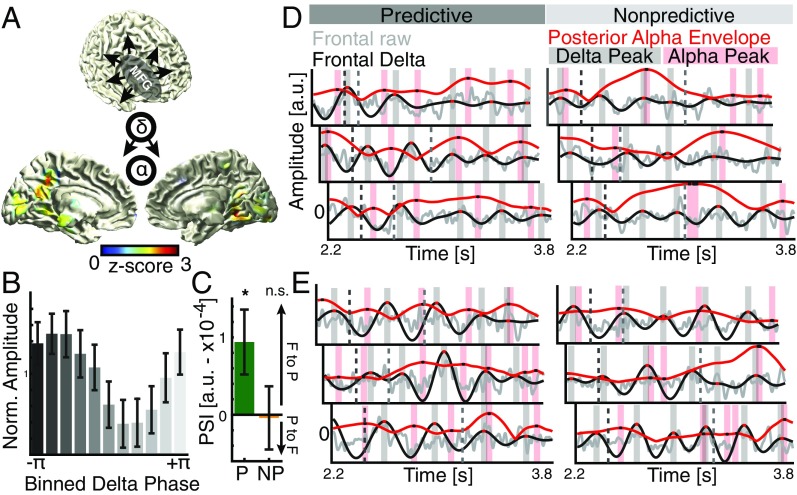
Fig. 4.
Interareal cross-frequency connectivity and directionality. (A) Whole brain cross-frequency correlations (delta–alpha phase-locking values) to a seed in the middle frontal gyrus comparing predicted and nonpredicted contexts (thresholded at P < 0.05; uncorrected paired t tests, one tailed). The strongest difference was observed over ventromedial parietooccipital areas. (B) Distribution of normalized alpha power in the 20% most significant voxels relative to the frontal delta phase. (C) Cross-frequency directionality analyses (PSI), indicating that the frontal delta phase predicts the instantaneous alpha amplitude only when top-down control was applied (Fig. S5). (D) Single trial examples from one subject. (Left) Predictive trials; (Right) nonpredictive trials. The dark dashed line indicates the offset of the predictive sequence; the gray dashed line indicates the target onset. Gray, raw signal in source space; black, delta filtered; red, rescaled alpha envelope. Red and black shaded areas and dots indicate the local peaks. Note the endogenous response to the predictive sequence (Left). On average, local alpha peaks (black dots on red trace) coincide with troughs of the delta rhythm (black trace) and vice versa (interleaved patterning of black and red after offset of the predictive sequence). This effect is most pronounced before target presentation (light gray dashed line). For nonpredictive trials (Right), there is no visible relationship between the delta signal and the alpha envelope. (E) Single trial examples from another participant. Same conventions as in D are shown.

