Fig. S1.
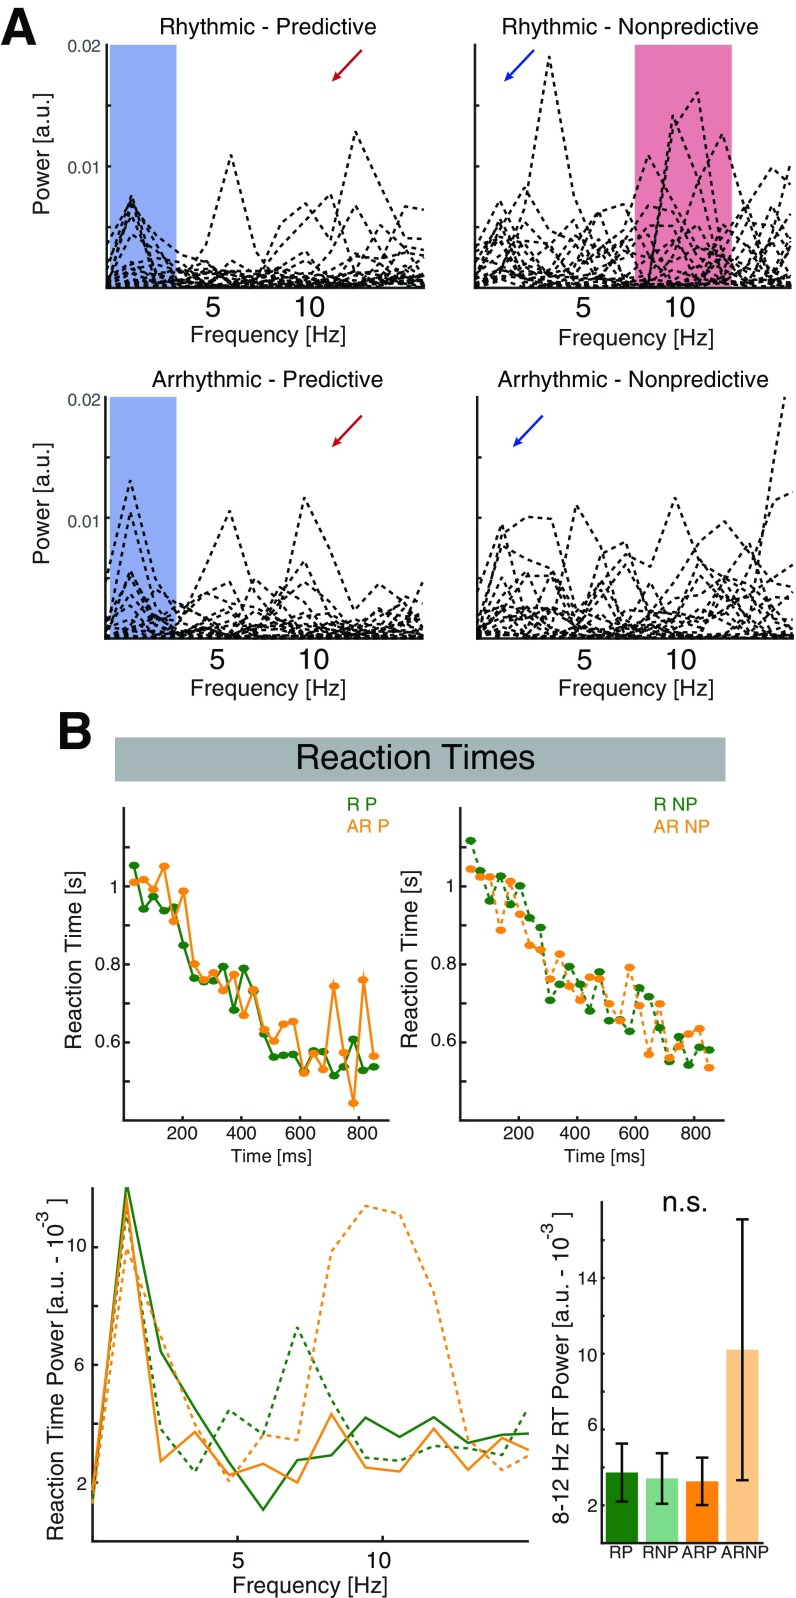
Individual hit rates spectra and reaction times. (A) Single subject spectrograms for all four conditions. The blue shaded area highlights the low-frequency range that exhibits an increased consistency during predictive contexts. The blue arrows (Right) highlight that this effect was less pronounced for the nonpredicted conditions. The red shaded area (Upper Right) highlights the increased consistency in the alpha range during rhythmic driving in absence of any top-down cues. Note, that more subjects exhibited a higher peak in the alpha band than during top-down guided visual processing (red arrows, Left). (B) Grand-average reaction time courses. Same conventions as in Fig. 1 C–F. Note the prominent hazard function, where reaction times become faster in later bins, given that the target has not been presented yet. When collapsed across time, we observed no significant effects of context (F1,17 = 4.26, P = 0.0547, η2 = 0.1369), rhythmicity (F1,17 = 0.93, P = 0.3480, η2 = 0.0122), or interaction (F1,17 = 4.41, P = 0.0510, η2 = 0.0168). After transforming the behavioral into frequency space by a fast Fourier transform (FFT), we assessed the power in the canonical 8- to 12-Hz alpha band. We did not find any differences between conditions (context: F1,17 = 1.02, P = 0.3275, η2 = 0.0212; rhythmicity: F1,17 = 1.08, P = 0.3135, η2 = 0.0193; interaction: F1,17 = 1.55, P = 0.2293, η2 = 0.0253).

