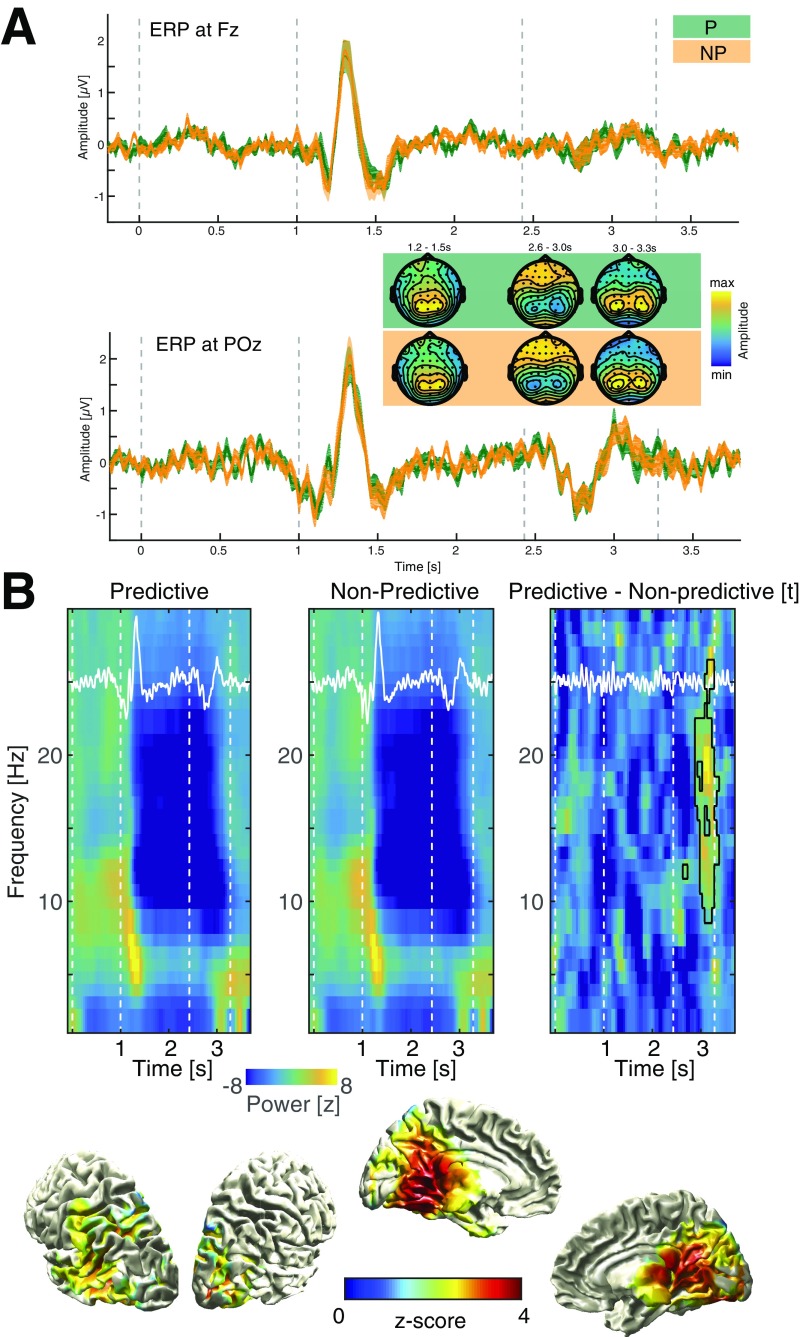
Fig. S4.
Event-related potentials and power differences between conditions. (A) Grand-average event related potentials for the predictive (green) and the nonpredictive (orange) conditions at Fz (Upper) and POz (Lower). Insets depict topographies at three time points where prominent deflections are visible. Please note that all topographies were scaled to the minimum and maximum in the respective time frame. We assessed differences between ERPs by means of cluster-based permutation statistics as implemented in FieldTrip, but found no significant differences (smallest p for a positive cluster P = 0.1299; smallest p for a negative cluster P = 0.1618). (B) Grand-average power differences (baseline corrected by means of z score). The event-related potential (ERP) is rescaled and superimposed in white. Note the prominent power decrease in the alpha/beta range in response to the visual input. We observed a strong decrease in oscillatory power in the alpha/beta range during the presentation of the sequence, which did not differ between conditions. However, we found a positive cluster (P = 0.0040) spanning the alpha/beta range (9–26 Hz) in the second half of the target interval (after 2.75 s into the trial), indicating a diminished reduction in power during predictive trials (see also Fig. S3B). Notably, this effect appeared after the alpha ITC effect (Fig. 3), which was present earlier in the trial (2.4–2.7 s). The Lower row highlights the spatial distribution in source space of this broadband effect (dpss multitaper in fieldtrip; center frequency 18 Hz ± 8 Hz; 2.75–3.4 s, masked at cluster-corrected P < 0.05; two tailed).

