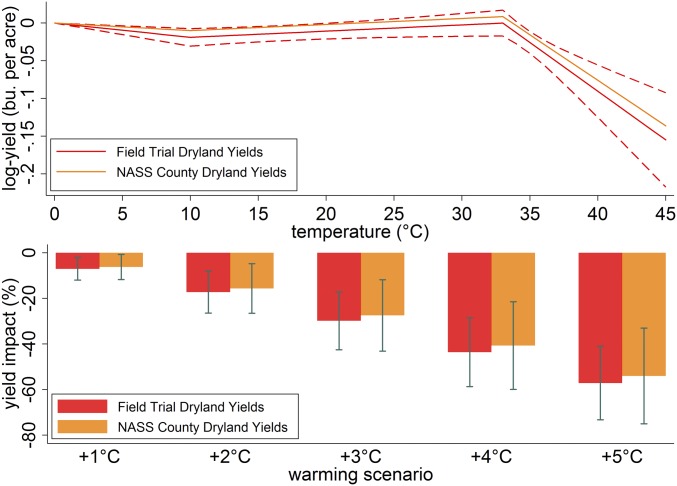
Fig. 1.
Nonlinear temperature–yield relationship and associated warming impacts across uniform changes in temperatures. (Top) Changes in log yield if the crop is exposed for 1 d (24 h) to a particular 1 °C temperature interval for both the field-trail data and the NASS county data. (Bottom) Estimated warming impacts as the percentage change in yield relative to historical climate. Dashed lines and error bars show 95% confidence intervals using spatially robust SEs clustered by year.

