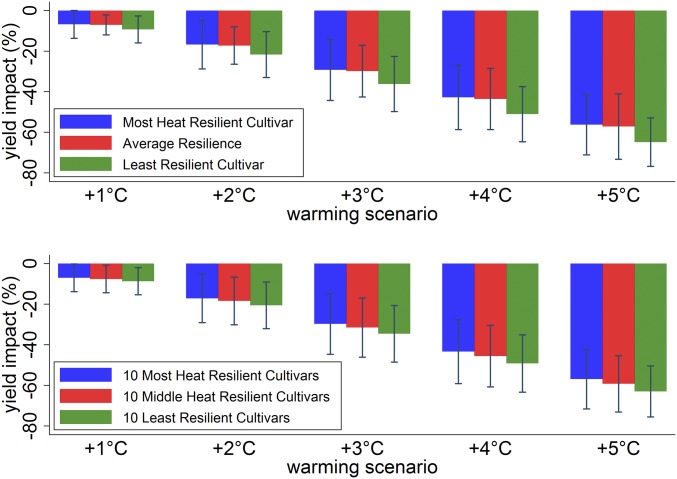
Fig. 3.
Predicted warming impacts on sorghum yields for the most and least heat resilient cultivars. This figure replicates Fig. 1 for various cultivars. Separate heat-resilience parameters are estimated for each cultivar and then used to predict warming impacts. (Top) Comparison of the most- and least-resilient cultivars to the average reported in Fig. 1. (Bottom) An average of the parameters within subgroups containing 10 cultivars each. Bars show 95% confidence intervals using spatially robust SEs clustered by year.

