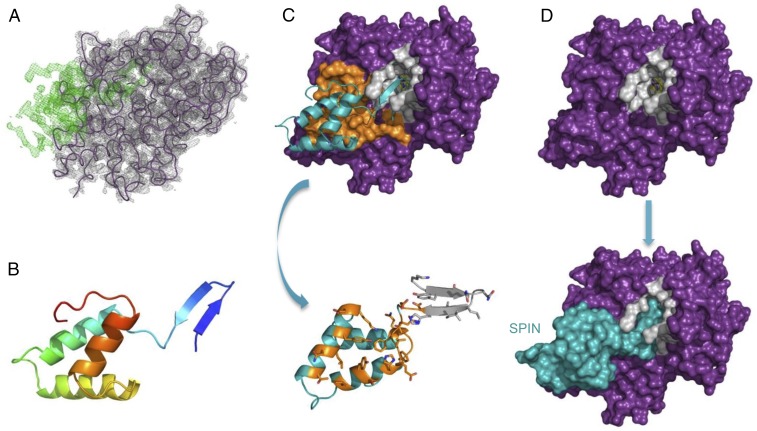
Fig. 2.
Structural basis for inhibition of MPO by SPIN. (A) Electron density maps (2.4-Å resolution) calculated after initial placement of an MPO model (Rfree = 28%). 2Fo–Fc density contoured at 1.5 σ (gray cage) is shown for the MPO model (purple wire), and Fo–Fc density contoured at 3.0 σ (green cage) is attributable to SPIN. (B) Structure of the SPIN polypeptide depicted as a ribbon diagram. N terminus of the protein is indicated in indigo, the C terminus in red. The orientation of SPIN has been maintained across A and B for clarity. (C) Representation of the final model for the SPIN/MPO complex. (Upper) SPIN is shown as a cyan ribbon while MPO is depicted as a molecular surface. Residues comprising the first SPIN binding interface are colored orange, and residues lining the MPO active site channel are colored gray. (Lower) SPIN is drawn with the residues found at the first interface colored orange, and residues interacting with the MPO active site channel are colored gray. The sidechains of interfacing residues are depicted in ball-and-stick convention. Note the orientation of SPIN in the Lower panel is flipped 180° in the viewing plane relative to the Upper panel. (D) Surface representations provide insight into the physical basis for MPO inhibition by SPIN. (Upper) MPO is shown as a molecular surface with the residues lining the active site channel in gray. (Lower) SPIN is drawn as a cyan molecular surface according to its position in the final model of the SPIN/MPO complex. The location of the reactive site heme from native human MPO (33) is shown as a colored ball-and-stick. Note that the SPIN β-hairpin appears to completely occlude access of small molecules to the reactive site heme.

