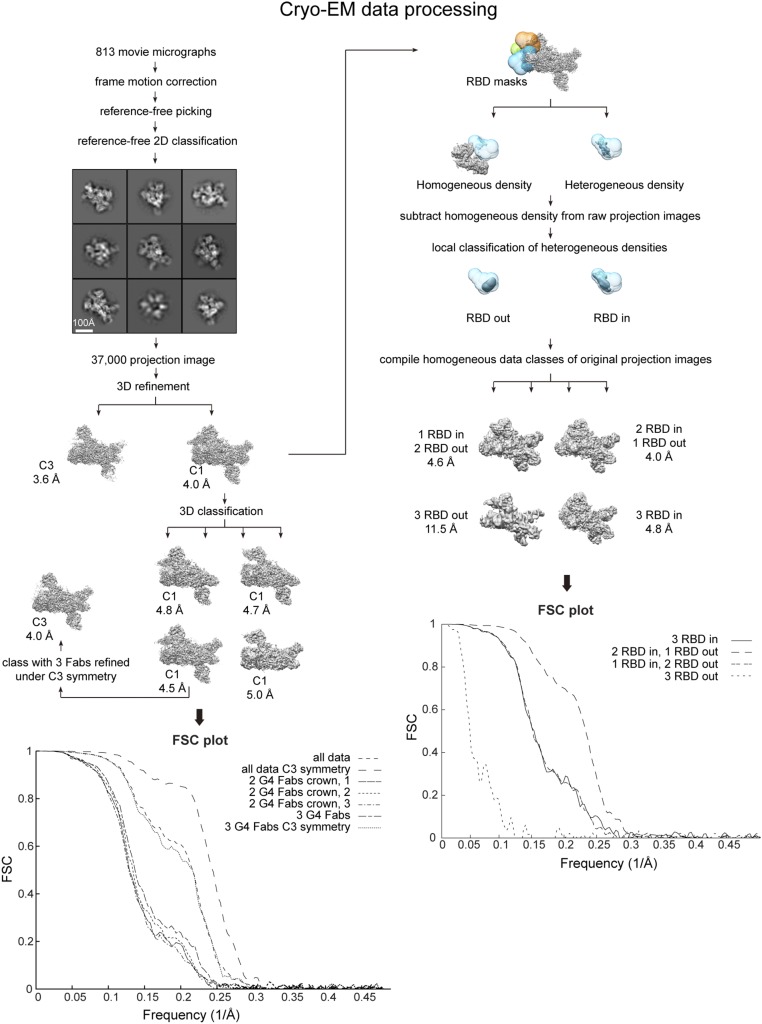
Fig. S2.
Cryo-EM data processing. Data were sorted and refined according to the flowchart. In particular, to resolve the heterogeneity in RBD configurations in our dataset we used a method of data sorting that involves subtraction of constant density regions from our raw data followed by local classification of the resulting projection images.

