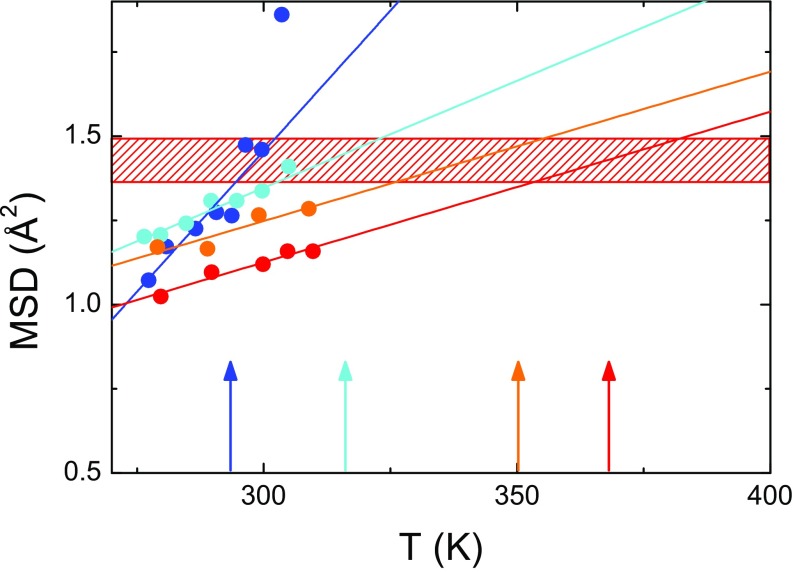
Fig. S7.
MSD of bacterial proteosomes with different thermal stability. Shown are psychrophile bacterium A. arcticum (blue circles), mesophile bacterium P. mirabilis (cyan circles), thermophile bacterium T. thermophilus (orange circles), and hyperthermophile bacterium A. pyrofilus (red circles). MSD data are from ref. 44. The arrows indicate the maximum growth temperatures for each bacterium (same color as relevant MSD symbols). The red hatched area highlights the region where critical MSD are attained, corresponding to the melting of the different proteins.

