Fig. 2.
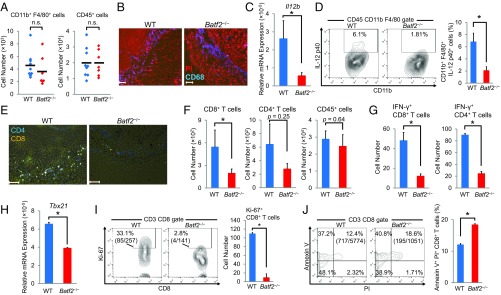
Analysis of immune cells within the tumors of WT and Batf2−/− mice. All samples were obtained from the tumor tissues of Batf2−/− and WT littermates 2 wk after B16-F1 implantation. (A) The numbers of tumor-infiltrating CD11b+ F4/80+ cells (Left) and CD45+ cells (Right). Data are from five independent experiments (n = 7–9). Bars show means. (B) Tumor tissue macrophages were examined by fluorescent staining of PI (red) and CD68 (blue). (C) Tumor tissue macrophages were sorted (n = 5–6), and their relative Il12b mRNA expression levels were quantified using qPCR. Data are expressed as mean ± SEM from three independent experiments. (D) The IL-12 p40 expressions of CD45+ CD11b+ F4/80+ macrophages from tumor tissues were analyzed by flow cytometry. Numbers represent the percentages of IL-12 p40+ cells within the CD45+ CD11b+ F4/80+ cell population. Representative plots are shown (Left). Data are expressed as mean ± SEM from three independent experiments (Right, n = 5). (E) Tumor-infiltrating T cells were examined by immunofluorescent staining of CD4 (blue) and CD8 (yellow). (F) Flow cytometric analysis of tumor-infiltrating CD8+ T cells, CD4+ T cells, and CD45+ cells. Numbers indicate the actual numbers of detected cells. Data are expressed as mean ± SEM from two independent experiments (n = 4). (G) Flow cytometric analyses of tumor-infiltrating IFN-γ+ CD4+ T cells and IFN-γ+ CD8+ T cells. Data are expressed as mean ± SEM from four independent experiments (n = 4). (H) Tumor-infiltrating CD4+ T cells were sorted (n = 2–3), and their relative mRNA expression levels of Tbx21 were quantified using qPCR. Data are expressed as mean ± SEM from two independent experiments. (I and J) Flow cytometric analyses of tumor-infiltrating, Ki-67+ CD8+ T cells (I) and Annexin V+ PI+ CD8+ T cells (J). Numbers represent the actual cell numbers and the percentages of these cells within the CD8+ T-cell population. Representative plots are shown (Left). Samples were obtained from one (I) or three pair(s) of mice (J). Data are expressed as mean ± SEM from two independent experiments (Right). All experiments were performed on male littermates. (Scale bar, 100 μm.) In all figures, *P < 0.05; n.s., not significant (P > 0.05).

