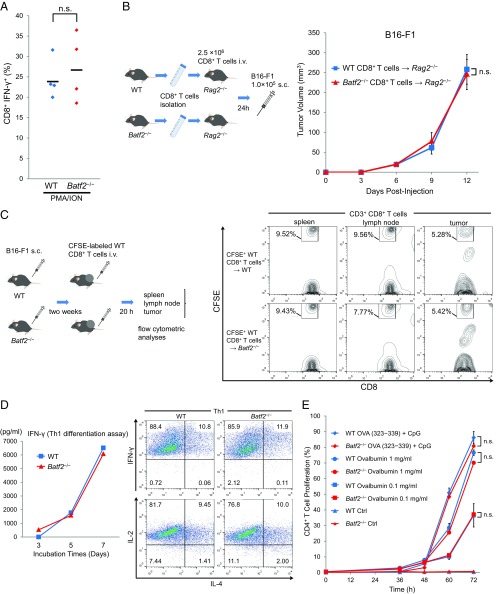
Fig. S4.
Analysis of the T-cell activities in Batf2−/− mice and WT littermates. (A) Splenic CD8+ T cells were isolated from Batf2−/− mice and WT littermates without tumors (naïve) and then stimulated with PMA and ionomycin (ION) for 4 h in the presence of monensin for the last 2 h. The IFN-γ expressions in these CD8+ T cells were analyzed by flow cytometry. Data are from two independent experiments (n = 4). (B) Naïve splenic CD8+ T cells isolated from Batf2−/− mice or WT littermates were transferred i.v. into Rag2−/− recipients. After 24 h, the recipient mice were injected s.c. with B16-F1 tumor cells (schematic, Left). Tumor growth was monitored (Right) in the mice with Batf2−/− CD8+ T cells (triangle) or WT CD8+ T cells (square). Average kinetics ± SEM of n = 3 mice per group. (C) In vivo migration assay. Naïve CD8+ T cells isolated from WT splenocytes (n = 14) were labeled with CFSE, and 2 × 10⁷ of these CD8+ T cells per mouse were injected i.v. into Batf2−/− or WT littermates. After 20 h, lymphocytes were obtained from the spleen, lymph nodes, and tumor tissues and analyzed by flow cytometry (schematic, Left). Data are representative of three independent experiments (Right). Numbers represent the percentage of cells within the CD8+ T-cell population. (D) Th1 differentiation assay. Naïve CD4+ T cells from Batf2−/− mice or WT littermates were purified by cell sorting. The cells were cultured in an anti-CD3 antibody-coated plate in the presence of mIL-12, anti–IL-4, mIL-2, and anti-CD28. ELISAs were performed to assess the changes in the culture medium IFN-γ levels over time (Left). After 7 d, the cells were analyzed by flow cytometry (Right). Data are representative of two independent experiments. (E) MHC II-restricted antigen-presentation experiments. CFSE-labeled OT-II transgenic CD4+ T cells were incubated with the splenic CD11c+ DCs from Batf2−/− mice or WT littermates in the continuous presence of 1 mg/mL or 0.1 mg/mL chicken ovalbumin or with 1 μM Ova peptide (323-339) together with 1 µg/mL CpG1826. The percentages of CD4+ CFSElow cells were assessed by flow cytometry after 72 h. A time course of changes in the percentages of the proliferating CD4+ T cells is shown. Data are expressed as mean ± SEM of duplicates. All experiments were performed on male littermates. Bars show means. In all figures, n.s., not significant (P > 0.05).

