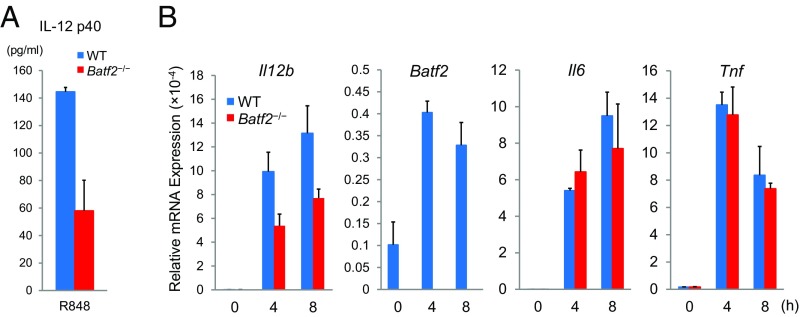
Fig. S5.
The gene expression levels in BMDCs. (A) Secreted IL-12 p40 levels of BMDCs that had been stimulated by R848 (100 ng/mL) for 24 h were measured by ELISA. Data are expressed as mean ± SEM of duplicates (n = 2). (B) The relative expression levels of indicated genes in BMDCs that had been stimulated by R848 for 4 h were quantified using qPCR. Data are expressed as mean ± SEM (n = 2). Similar results were obtained in two independent experiments.

