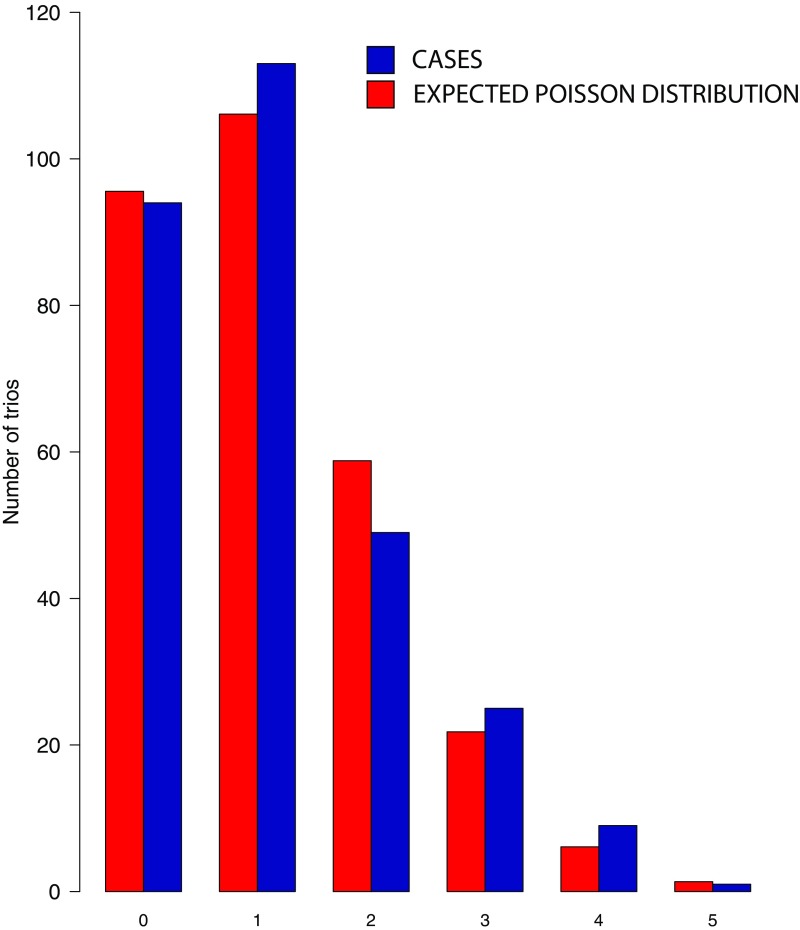
Fig. S1.
Number of de novo mutations identified per proband in 291 craniosynostosis trios. The blue bars represent the observed distributions of de novo mutations identified per proband in craniosynostosis kindreds, and the red bars represents the expected number from the Poisson distribution. The observed distribution closely approximates expectation.

