Figure 1.
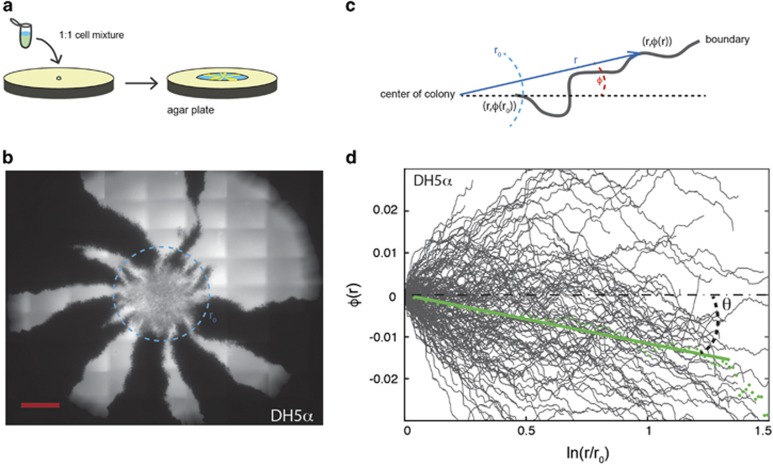
Competition experiments between neutral E. coli strains expressing different colors, either yellow fluorescent protein (YFP) (yellow) or cyan fluorescent protein (CFP) (cyan). (a) Sketch of the experiment where the two species are mixed 1:1, diluted 1/10, and inoculated on an agar plate where the borders between competing expanding strains are visible. (b) An example of an expanding E. coli DH5α colony is shown from the agar side; the cells transformed with CFP appear white and those with YFP black in this image. The radius of the light-blue dashed circle equals r0. The scale bar corresponds to 1 mm. (c) Illustration of the parameterization, (r, φ(r)), of a point on the sector boundary where r is the length of the radial vector (blue) from the center of the colony and φ(r) is the angle (denoted with orange) between the direction of the sector boundary (dashed orange line) and the radial vector. (d) Parametrization, φ(r), of individual E. coli DH5α sector boundaries (N=146) plotted on semilog scales. The green dots show the average boundary, 〈φ(r)〉, and the full green line shows the best linear fit to the average boundary. As clear from Equation (1), the slope of the fit is the dimensionless measure of chirality: v⊥/v∥=tan(θ). Note that, although the behavior of individual boundaries appear erratic due to random wandering of the boundaries, the average over 146 colonies shows a clear negative slope due to chirality. The values of v⊥/v∥ and θ for all strains investigated are given in Table 2.

