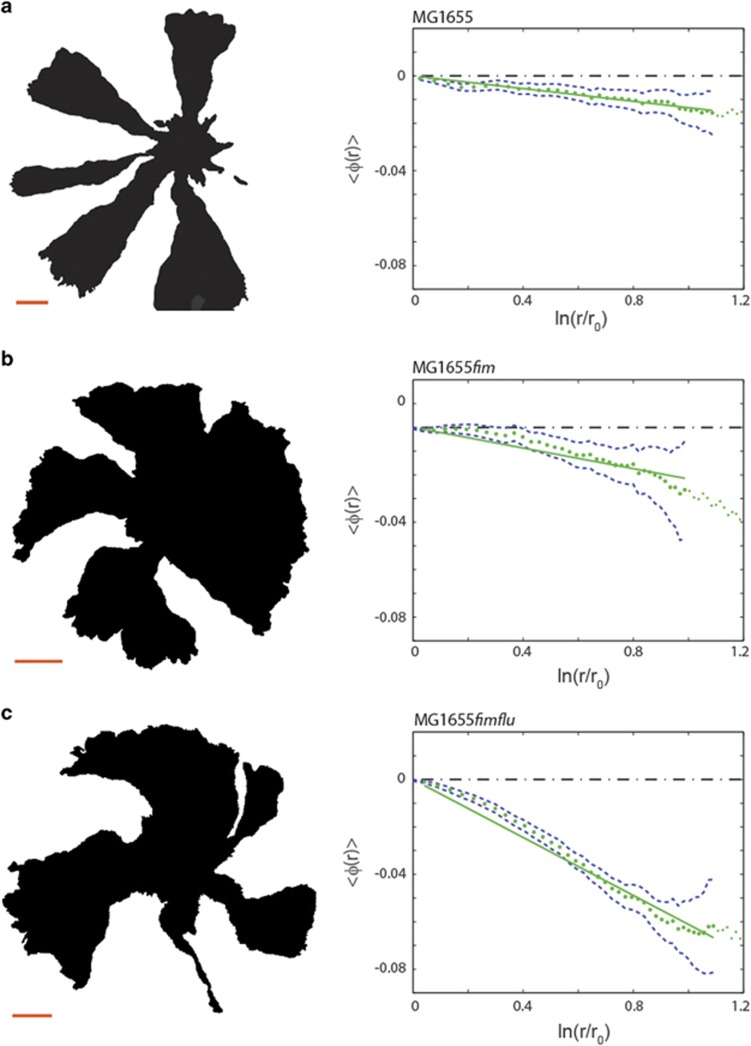
Figure 2.
The sector boundaries show different degrees of chirality depending on expression of surface structures. The left panels show examples of intensity thresholded images (displayed from the agar side) of different E. coli MG1655 mutants in competition experiments; the scale bars are 1 mm. The right panels show the average boundary angle, 〈φ(r)〉 (green dotted line), a linear fit (full green line) and one standard error of the mean (blue punctuated line). (a) Results from competition experiments with the mother strain, MG1655; this colony expansion is only slightly chiral (N=369). (b) Competition experiments with the MG1655fim strain lacking pili (N=831). This strain exhibits more chiral borders than MG1655. (c) Competition experiments with the double deleted MG1655fimflu strain lacking both Antigen 43 and pili (N=636). This double deletion causes even more pronounced chirality compared with the single deletion mutants.

