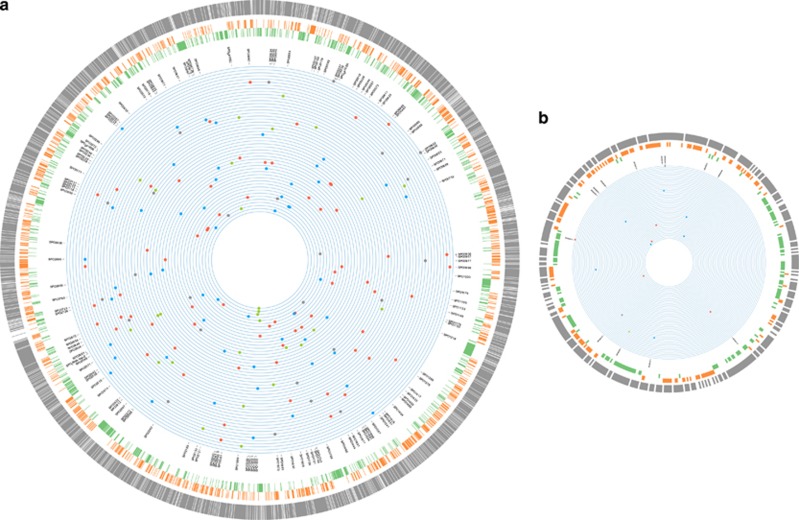
Figure 1.
The genomic locations of the base-substitution mutations and insertion/deletion mutations in the 48 independent mutation accumulation (MA) lines of Ruegeria pomeroyi DSS-3. From outer to inner rings scaled to genome size: (1)–(3) The three outermost rings represent gene density (gray), G/C content (orange) and A/T content (green), respectively, calculated in non-overlapping 1 kb blocks. If the value of the 1 kb block is above the genome-wide mean, the 1 kb block is colored; (4) locus tag of genes with mutations; (5) position of each base-substitution mutation (A/T→G/C (red), G/C→A/T (blue) and A↔T or G↔C (grey)), as well as insertion/deletions (green) in MA lines, with each ring representing the genome of an individual MA line. The chromosome (a) and megaplasmid (b) of DSS-3 are not plotted in proportion to their number of nucleotides in order to make the features of the latter visible.

