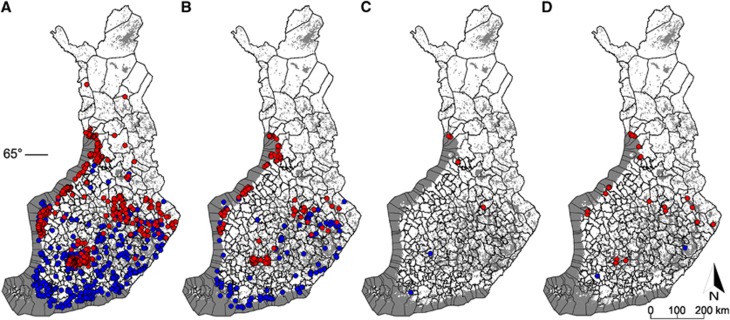
Figure 3.
(A) Distribution of the samples that were screened for pathogens (n=2038). Blue dots indicate collection points for I. ricinus samples (n=1044) and red dots indicate collection points for I. persulcatus samples (n=994). (B) Distribution of the samples that were positive for Borrelia burgdorferi s.l. (n=345). (C) Distribution of the samples that were positive for B. miyamotoi (n=6). (D) Distribution of the samples that were positive for TBEV (n=32).

