Figure 1.
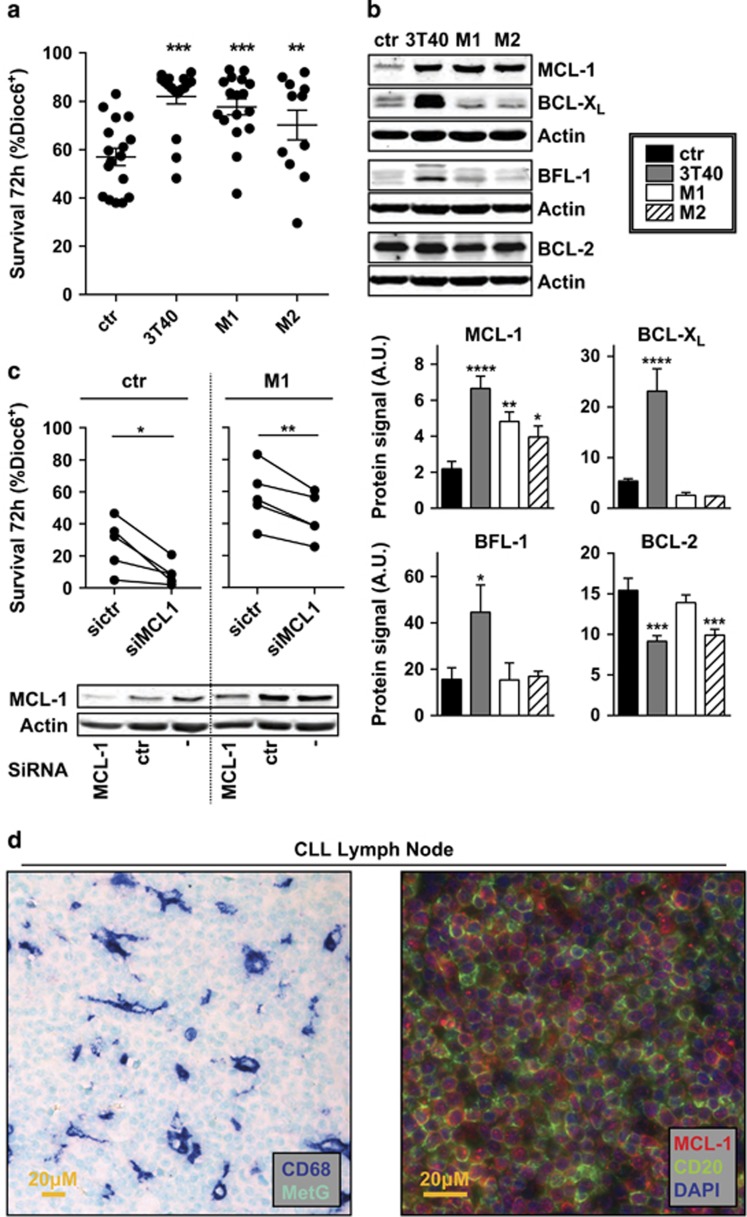
Mϕs and CD40L induce CLL survival by changing the apoptotic balance. Confluent feeder layers of Mϕs and non-dividing CD40L-overexpressing fibroblasts (3T40) were generated as described under Materials and methods section. (a) CLL cells were co-cultured on the indicated feeder layers or without feeder layer (ctr) for 72 h after which survival was measured by Dioc6-PI staining. The percentage of viable cells was defined as Dioc6-positive cells. Each point represents one stimulation of a CLL sample. Shown are mean ±s.e.m. (b) After 72-h co-culture as in a, protein lysates of CLL cells were probed by western blot for the levels of pro-survival BCL-2 family members MCL-1, BCL-XL, BFL-1 and BCL-2. β-Actin was used as a loading control. Data shown are representative of at least N=6. To improve clarity, western blot images were cropped in this and following figures (upper panel). The levels of each protein were quantified for six patients using densitometry and calculated as the protein signal relative to the actin loading control (lower panel). A.U. denotes arbitrary units. (c) CLL cells were transfected with one of two siRNAs directed against MCL-1 (siMCL-1) or a control (sictr) or not transfected (−) before co-culture on Mϕs or without feeder layer (ctr). After 72 h, the viability of CLL cells was determined as in a. Each line represents one patient sample. Transfection efficiency using a green fluorescent protein control plasmid has previously been determined to be approximately 50% (data not shown) (upper panel). Protein lysates of CLL cells were probed for MCL-1 levels by western blot to verify the knockdown. β-Actin was used as a loading control. Data shown are representative of N=5 (lower panel). (d) Paraffin-embedded LN slides from CLL patients were immunohistochemically stained for Mϕ marker CD68 and nuclear counterstain methyl green (left panel), or MCL-1, B-cell marker CD20 and nuclear counterstain 4,6-diamidino-2-phenylindole (DAPI; right panel). Data shown are representative of N=6. *P<0.05; **P<0.01; ***P<0.001; ****P<0.0001 in an analysis of variance (ANOVA) test with Dunnett’s post-hoc test (a, b) or in a t test (c).

