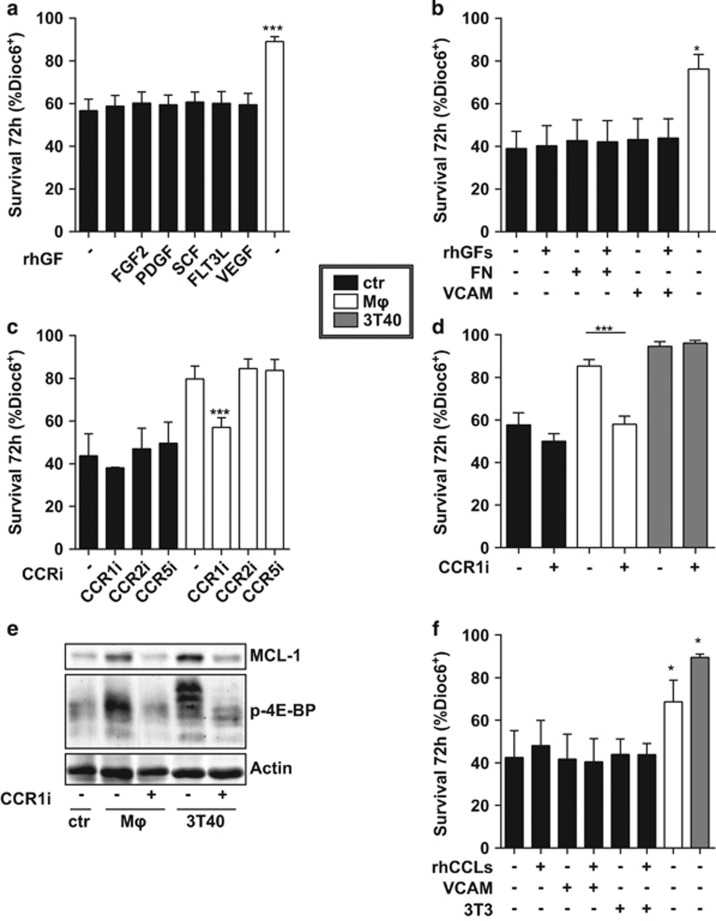
Figure 4.
MCL-1 upregulation and CLL cell survival are CCR1 dependent. (a) CLL samples were cultured in the presence of 25 ng/ml epidermal growth factor (EGF), 20 ng/ml basic fibroblast growth factor (FGF2), 10 ng/ml platelet-derived growth factor (PDGF), 50 ng/mll stem cell factor (SCF), 25 ng/ml Fms-related tyrosine kinase 3 ligand (FLT3L), 10 ng/ml vascular endothelial growth factor (VEGF), or nothing or on Mφ for 72 h and survival was measured. Shown are mean±s.e.m. for N=6 CLL samples. (b) CLL cells were cultured without feeder layer, or on fibronectin coated plates (FN), on VCAM-coated plates (VCAM) or on Mφ for 72 h in the presence of absence of a combination of the growth factors (rhGFs) used in Figure 5a. Survival is shown as mean±s.e.m. for N=3 CLL samples. (c) CLL cells were co-cultured on Mφ or without feeder layer (ctr) for 72 h in the presence of absence of specific CCR inhibitors against CCR1 (1 μg/ml BX471), CCR2 (100 ng/ml INCB3284) or CCR5 (1 μM Maraviroc). Next, survival was measured as in Figure 1a. Shown are mean±s.e.m. for N=3 CLL samples. (d) CLL cells were co-cultured on indicated feeder layers or without feeder layer (ctr) for 72 h in the presence of absence of CCR1 inhibitor BX471. Next, survival was measured as in Figure 1a. Shown are mean±s.e.m. for N=9 CLL samples. (e) After 72 h co-culture as in Figure 3d, protein lysates of CLL cells were probed by western blot for MCL-1 and p-4E-BP. Note that the smear for p-4E-BP in the Mφ sample could result from differently phosphorylated 4E-BP forms. Data shown for one patient are representative of N=3. (f) CLL cells were co-cultured on indicated feeder layers for 72 h or cultured with a combination of CCR1-binding chemokines CCL3, 5 and 23 on non-coated or VCAM-coated plates or on 3T3 cells. Next, survival was measured as in Figure 1a. Shown are mean±s.e.m. for N=3 CLL samples comparing each feeder layer with to without chemokines or Mφ or 3T40 to control. *P<0.05; ***P<0.001 in an ANOVA test with Dunnett’s (a, b, f) or Newman-Keuls (c, d) post-hoc test.

