Figure 7.
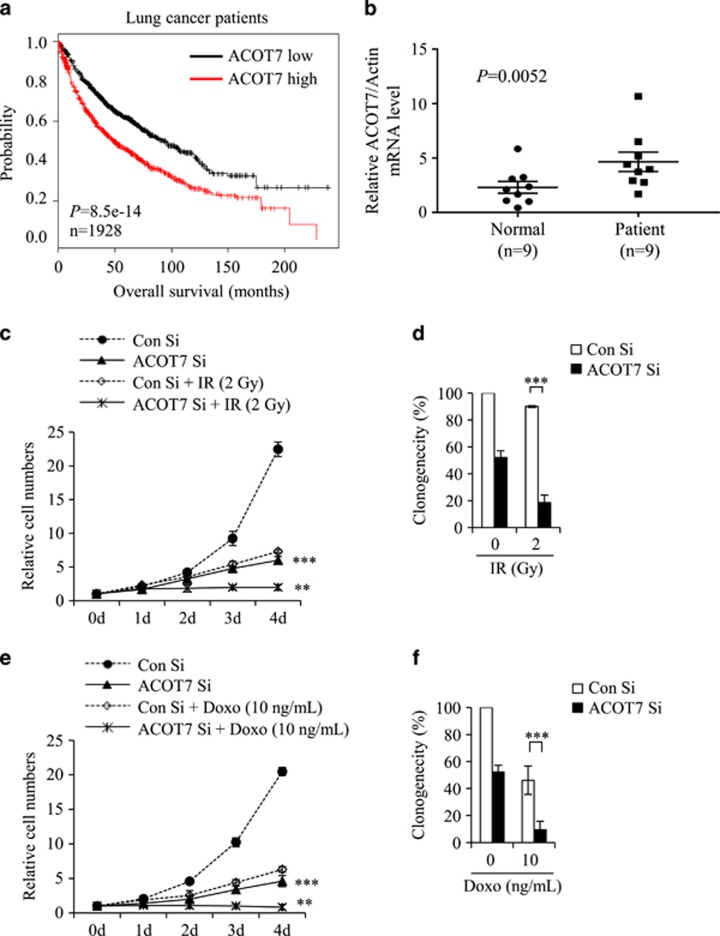
Effect of ACOT7 depletion in irradiated and anti-cancer drug-treated lung cancer cells and patients. (a) Kaplan–Meier curves of overall survival times of patients with lung cancer. Data were obtained from http://kmplot.com/analysis/. Statistical significance was determined using the log-rank test. (b) Quantitative RT-PCR analysis of ACOT7 mRNA in patient tissues. RNA was purified from lung cancer tissues and corresponding normal counterparts from nine patients and subjected to qRT-PCR using ACOT7-specific primers. Expression levels were normalized to actin mRNA. Error bars represent ±S.E.M. (c and d) A549 cells were transfected with Con Si or 10 nM ACOT Si prior to exposure to 2 Gy of IR. Relative cell numbers were determined on the indicated days (c). Colony-forming assay was performed after 7 days (d). (e and f) A549 cells were transfected with Con Si or 10 nM ACOT Si prior to treatment with 10 ng/ml of Doxo. Relative cell numbers were determined on the indicated days (e). Colony-forming assay was performed after 7 days (f). The value represents the mean±S.D. from three independent experiments. *** and ** indicate statistical significance of P<0.001 and P<0.01 by Student’s t-test, respectively

