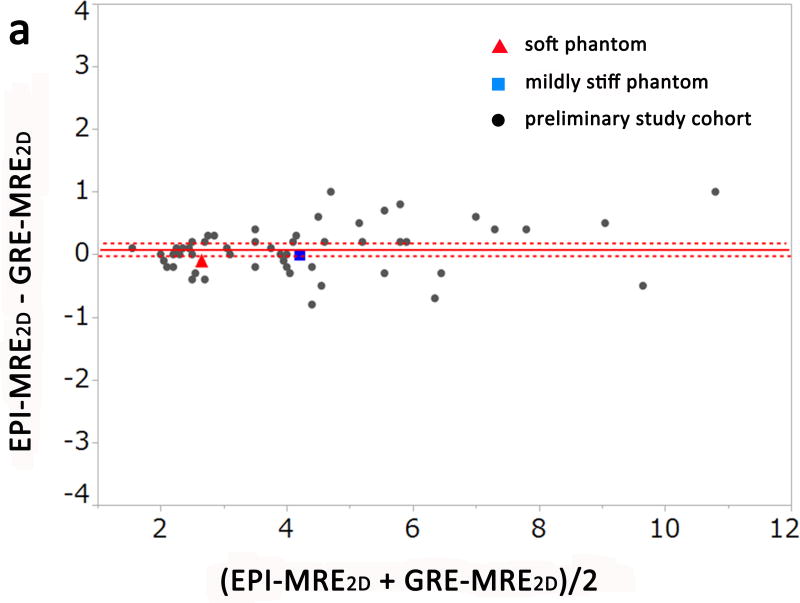
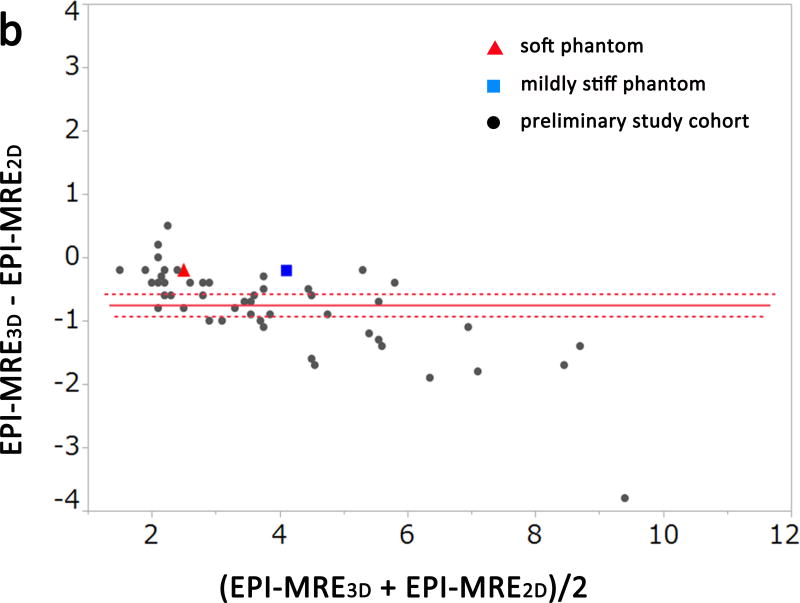
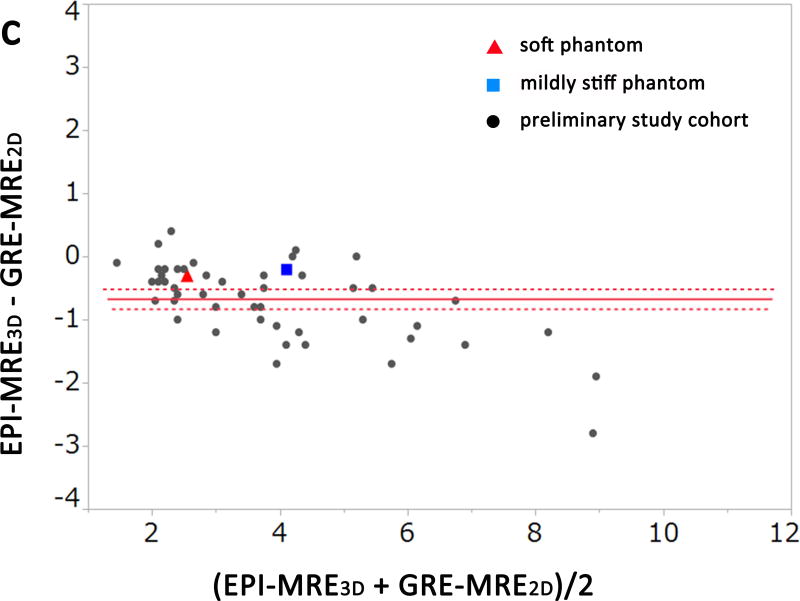
Figure 2.
Bland-Altman plots of the measured stiffness values of the phantoms and the preliminary study cohort for observer 1. There was no significant difference between EPI-MRE2D and GRE-MRE2D (a, p = 0.101). Meanwhile, liver stiffness values from EPI-MRE3D were significantly lower than those of the other methods (b and c, p < 0.001).


