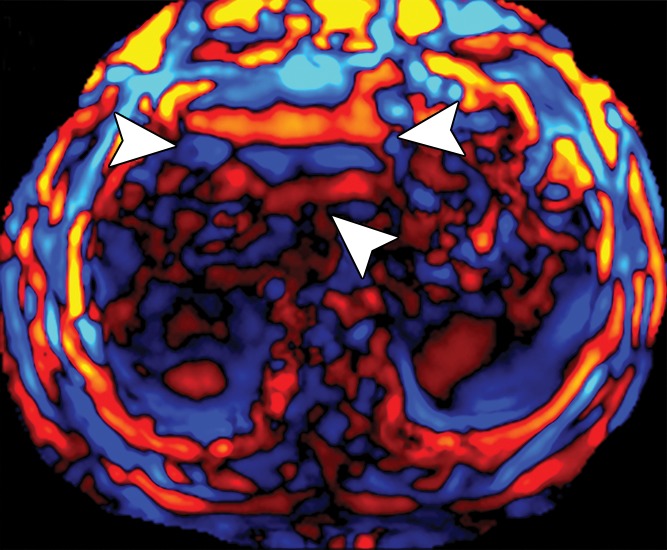
Figure 13h.

Assessment of adequate wave propagation at MR elastography illustrated with images from four different patients. (a, b) Normal wave propagation. A magnitude image (a) depicts a focal region of artifact (arrow on a) directly beneath the passive driver, which is a reliable indicator that the generator is turned on and that the driver is transmitting pressure waves. The wave image (b) in this case shows wide waves that are due to the stiff parenchyma (arrows on b). (c, d) No wave propagation: images obtained with the driver tubing disconnected. A magnitude image (c) shows the absence of subcutaneous artifact within the subcutaneous fat. The wave image (d) in this case shows variable signal intensity in the liver (arrowheads on d) caused by noise, with a lack of propagating waves. (e, f) Poor wave propagation because of interposed colon. A magnitude image (e) shows a normal artifact (arrow on e) under the passive driver, but the wave image (f) shows a lack of propagating waves in the liver. The cause was interposed colon, which can be recognized by identifying the susceptibility artifact (arrowhead on e) from the luminal gas. (g, h) Successful wave propagation with the driver placed over the left lobe. MR elastography with the driver over the right lobe had failed to produce waves because of interposed colon secondary to right hepatic atrophy. The magnitude image (g) obtained after the driver was moved to a midline position shows a normal susceptibility artifact (arrow on g) over the left hepatic lobe. The wave image (h) shows that this adjustment in the driver position resulted in good-quality wave propagation (arrowheads on h) in the left hepatic lobe.
