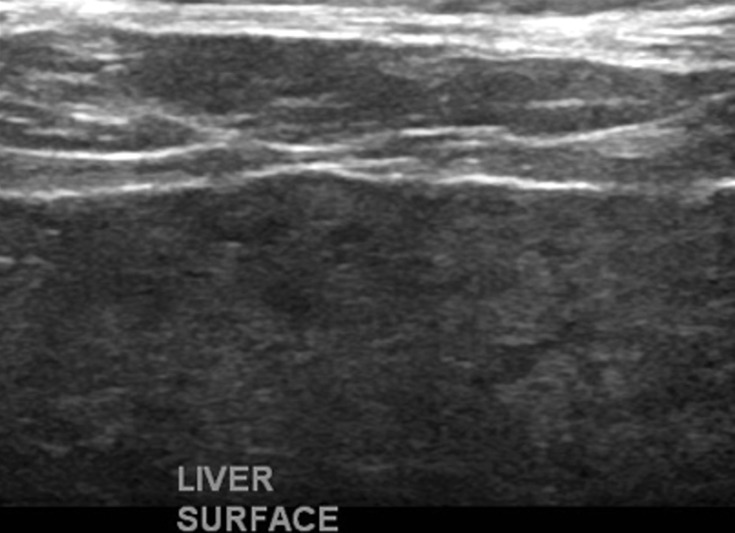
Figure 6c.
US elastography of a 62-year-old woman with hepatitis C and cirrhosis. (a) Tabulation of 12 velocity measurements (V1–V12) shows an increased median velocity (V Median) of 1.92 m/sec (>1.77 m/sec), a finding that classifies the patient into the high-risk category according to a recent consensus conference statement by the Society of Radiologists in Ultrasound (48). This patient will require prioritization for therapy and further follow-up. (b) US elastographic image shows a mixture of colors that is due to the tissue stiffness variation within the ROI. In this and the subsequent US elastographic images, the yellow box (yellow arrows) is the field of view of the shear-wave sample area, and the dashed circle (white arrows) is the location where the actual velocity measurements are obtained and recorded (1 = ROI 1). (c) Conventional transverse US image of the liver surface shows surface nodularity, a finding that indicates cirrhosis.

