
Figure 6. SGI-110 treatment enhances HLA-ABC and ICAM1 expression in KG1a cells treated in vitro.
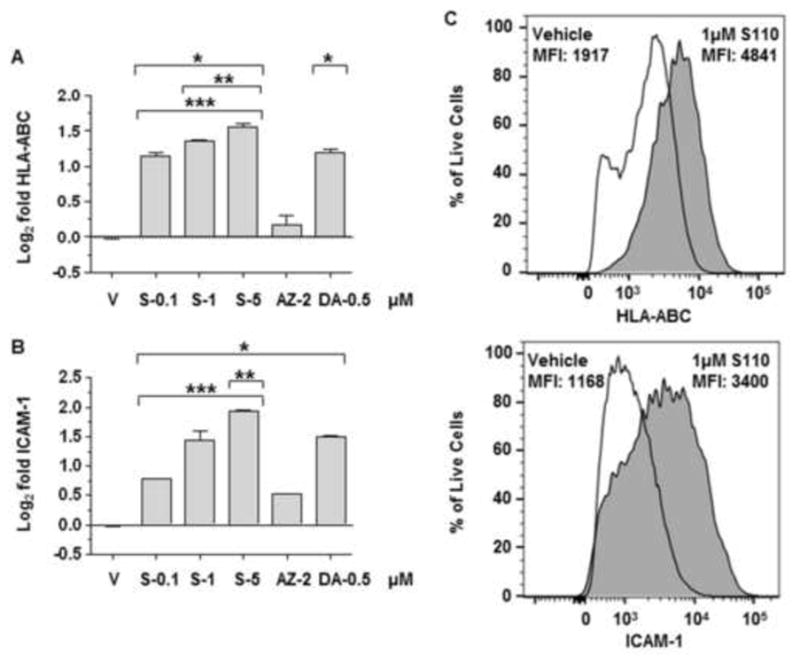
KG1a cells treated with SGI-110, DAC, or AZA, expression of A) HLA-ABC and B) ICAM1 determined by flow cytometry. Data represent the Log2 transformation of the MFI post treatment vs. average MFI vehicle control from three experiments. C) Representative flow plots for vehicle and SGI-110 5uM treated KG1a cells. Live, single KG1a cells were used to determine HLA-ABC expression or ICAM1. For simplicity, only KG1a cells treated with vehicle or 1 μM SGI-110 are shown. * p<0.05 vs. vehicle, **p<0.05 vs. DAC, ***p<0.05 vs. AZA, MFI- Median fluorescence intensity.