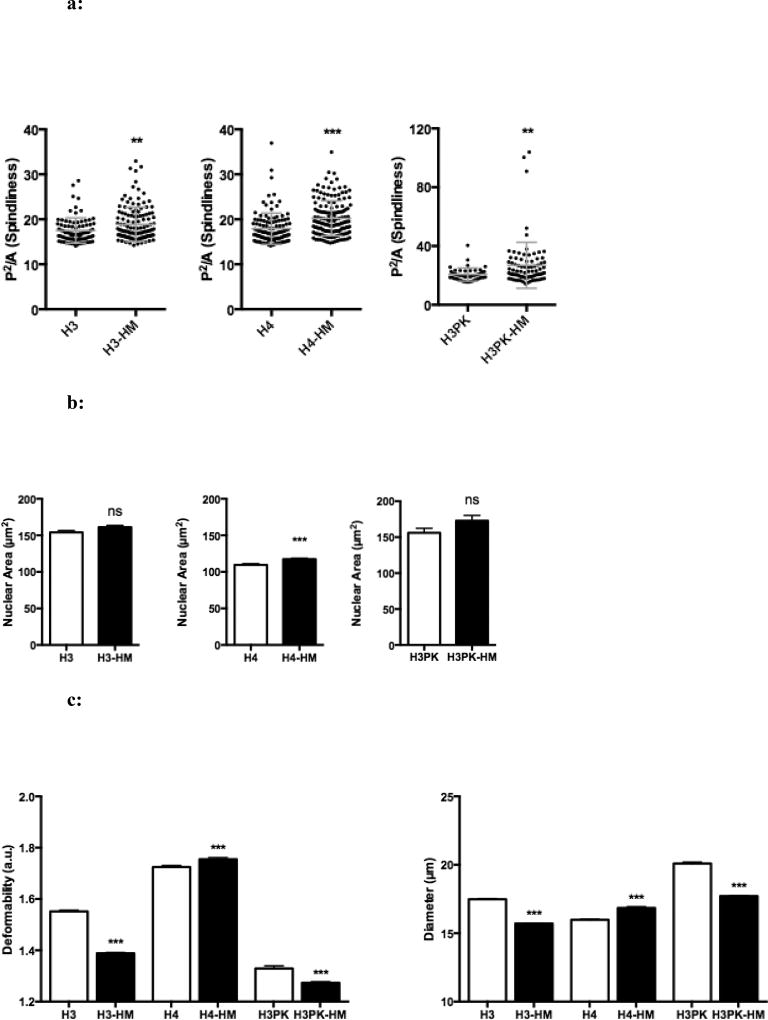
Figure 3.
a: Micropore selection reveals cells having the greatest protrusion intensity. Protrusion intensity, defined as the square of the perimeter divided by area (P2/A) of each cell, was determined using ImageJ. At least 45 cells were analyzed per group; each dot represents the protrusion intensity observed for a single cells. Mean ± SEM. **, P < 0.01; *** P <0.001.
b: Selection does not bias nuclear cross sectional area as determined by post-migration size analysis. Nuclear area was determined by Lamin B1 immunofluorescence of at least 60 cells per group. Mean ± SEM. ***, P < 0.001.
c: Deformability Cytometry (DC) reveals cell line-specific deformability phenotypes coinciding with highly migratory behavior. Graphs show deformability and diameter of at least 1000 unselected and HM cells. Mean ± SEM. *, P < 0.001.

