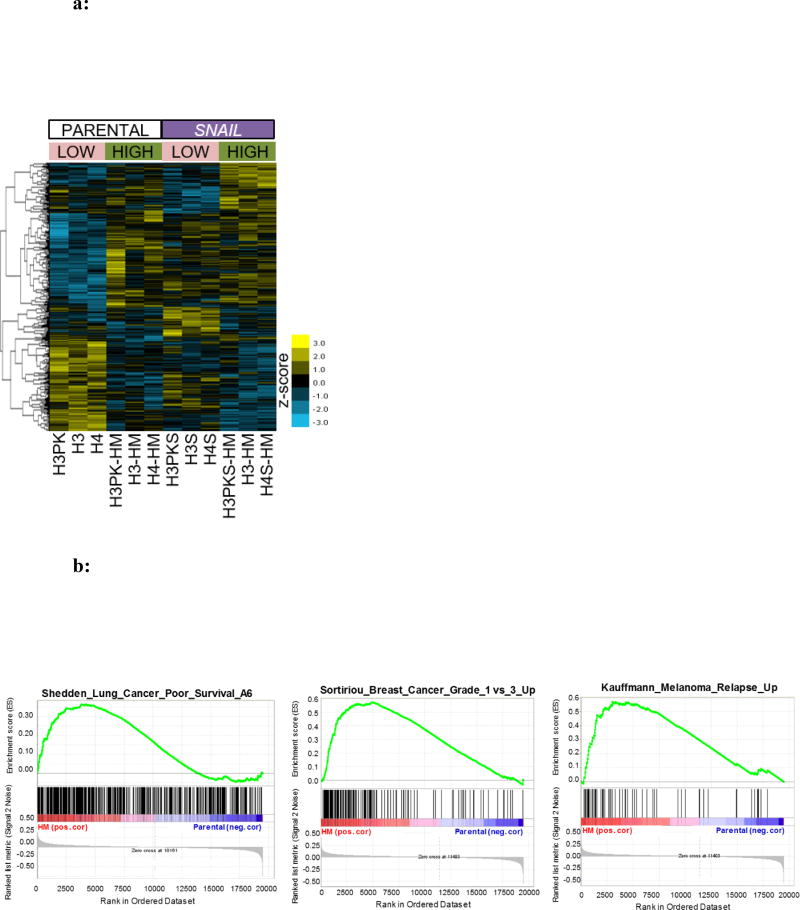
Figure 6.
a: Heat map of gene expression in parental and highly migratory HBECs. The map is organized by parental cell lines (left six columns) and SNAI1 over-expressing cell lines (right six columns), then by low (unselected) versus high migration. This aids in highlighting genes most influenced by migration in SNAI1-dependent and -independent ways.
b: Gene set enrichment analysis reveals correlation between genes associated with high migration rates and poor survival in non-small cell lung cancer and breast cancer or melanoma recurrence. Enrichment plot of two gene sets significantly (false discovery rate q-value < 0.01) associated with high mobility SNAI1 HBECs as compared to non-selected parental cell lines.

