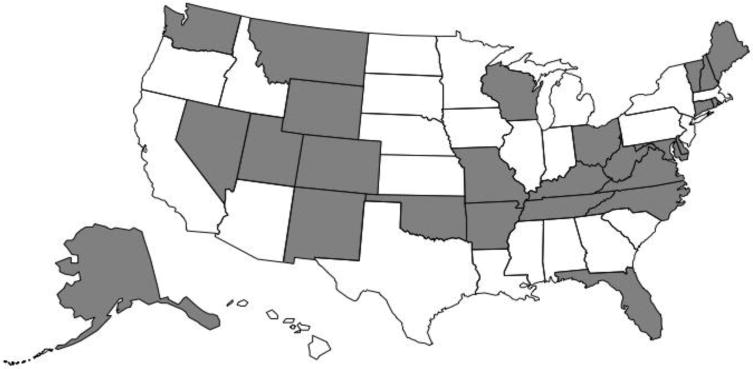
Figure 1. Map of US states by high and low prescription opioid overdose mortality rates.

Notes. High overdose states (in gray) are those at or above 5.5 prescription opioid overdose deaths per 100,000 residents in 2013, based on data extracted from the CDC (2015) WONDER database. Low overdose states (in white) had fewer than 5.5 prescription opioid overdose deaths per 100,000 residents in 2013. The District of Columbia was in the group of low overdose states.
