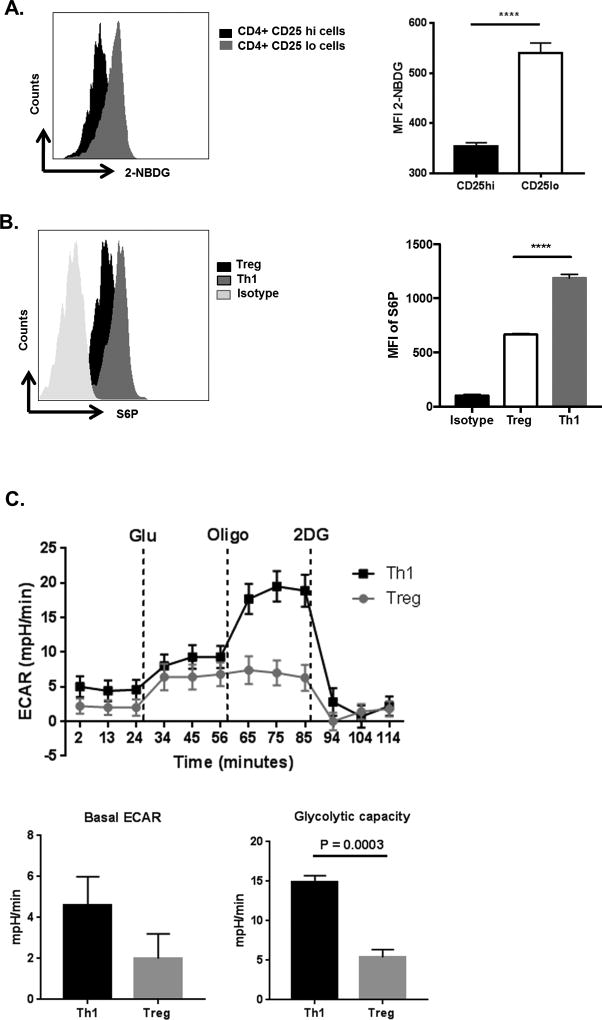
Figure 3. CD4 T cells from infected and naïve animals have different glucose metabolism.
(A) C57BL/6 animals were infected with 1 × 10⁴ PFU of HSV-RE and at day 15 pi animals showing SK lesions were administered with 2-NBDG (i.v) and glucose uptake by different CD4 T cell subsets was measured in DLNs. Representative FACS plots and histogram (MFI) showing the 2-NBDG uptake in Live cells of Treg (CD4+CD25+) cells and Teff (CD4+CD25−) cells as measured in DLNs at day 15 pi. (B) DLNs at day 15 pi were stimulated PMA/Ionomycin followed by ICS assay. Representative FACS with Isotype control and histogram (MFI) of S6P in Treg (CD4+ Foxp3+) and Th1 (CD4+ IFN-γ+) cells. Dead cells were gated out using Live/Dead staining. Data represents the mean ± SEM of more than 3 independent experiments (n = 3–5 mice/group) (C) Naive CD4 T cells purified from C57BL/6 mice were cultured in either Treg or Th1 differentiating conditions. After 5 days, equal number of cells were used of extracellular flux analysis. Line graph showing changes in extracellular acidification rates (ECAR) by CD4 T cells following addition of glucose, oligomycin and 2DG and Histograms showing basal ECAR and glycolytic capacity. Data represent the mean values ± SEM of two independent experiments of n = 4. The level of significance was determined by Student’s t test (unpaired). P≤ 0.0001 (****)

