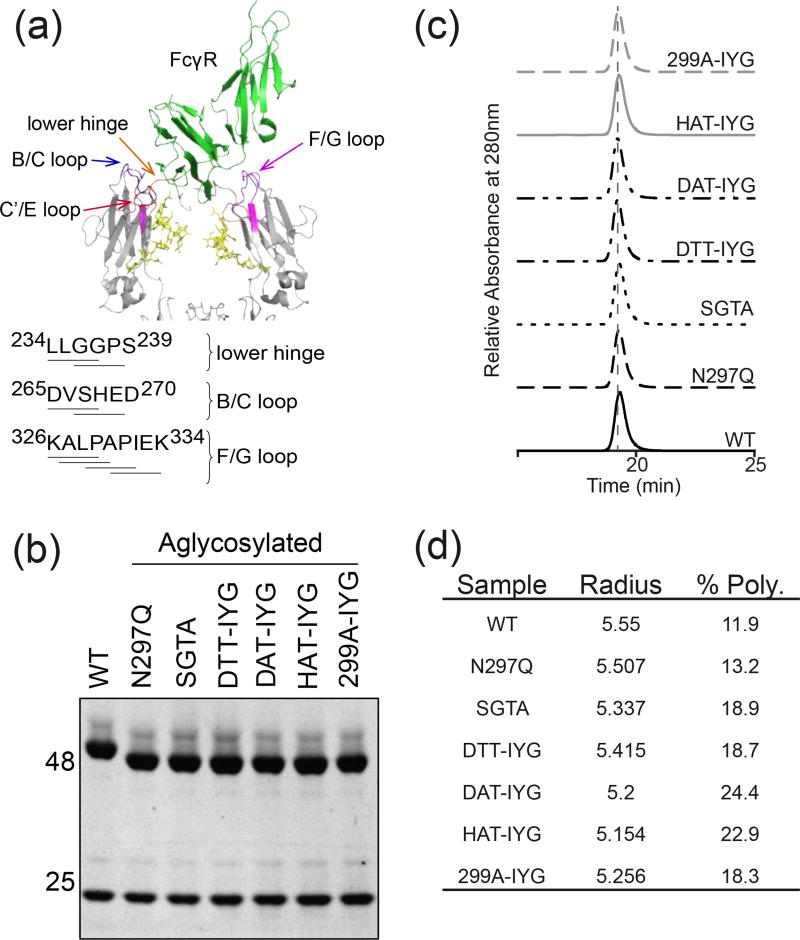
Figure 1.
Characterization of aglycosylated antibodies. (a) Cartoon representation of the crystal structure of the hIgG1 Fc complex with hFcγRIII (PDB ID 1E4K). FcγRIII is shown in green, and both chains of the Fc in pale blue. Fc contact surfaces are colored: lower hinge (orange), B/C loop (blue), C’/E loop (red), and F/G loop (purple). Fc glycosylation is shown in yellow. Sequences identifying Fc mutagenized regions of the lower hinge, B/C loop, and C’/E loop. (b) SDS-PAGE gel of reduced antibodies. Aglycosylated heavy chains demonstrate higher mobility on the gel because of the lack of the large glycosylation group (c) SEC-HPLC profiles of aglycosylated constructs. (d) Aglycosylated constructs measured with DLS at 1 mg/ml in 1×PBS buffer. Hydrodynamic radii fall within the normal antibody range of 5–6nm. % Polydispersity demonstrates whether the protein preparations are monodisperse (below 20% is considered monodisperse).

