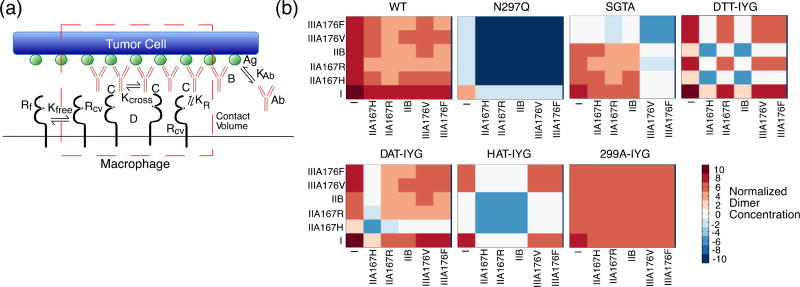
Figure 2.
Mathematical Model of Phagocytosis. (a) Diagram of phagocytosis where the red dotted outline represents the contact volume between tumor cell (top) and macrophage (bottom). Antibody “Ab” can bind to the antigen “Ag” with an equilibrium constant of KAb to become bound antibody “B”. Free FcγR “Rf” can diffuse into the contact volume (red dotted line) to become Rcv, and only FcγR in the contact volume “Rcv” can bind to bound antibody “B” with an equilibrium constant of KR to form complexes “C”. Only complexes “C” can dimerize with an equilibrium constant of Kcross to form dimers “D”. (b) Heat maps of normalized dimer concentrations based on the mathematical model. Heat maps are plotted on log10 scale. Red signals an increase in concentration and blue a decrease in concentration. Labels represent each different human Fcγ receptor and allelic variants.

