
Fig. 2.
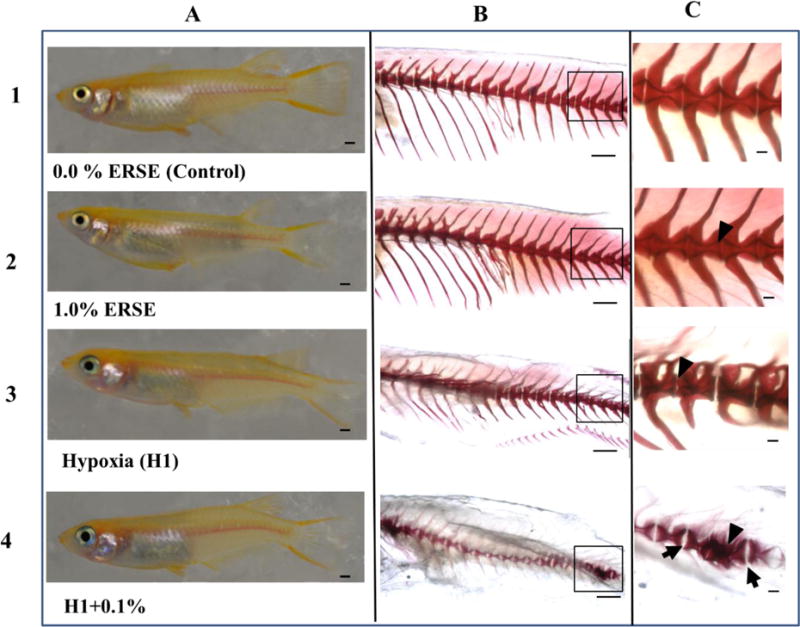
Representative axial skeleton of F0 adults at 120 dpf. Different views/magnifications of representative individuals are in columns: (A) Digital images of anesthetized, laterally oriented control and exposed fish, scale bar is 1 mm., (B) Alizarin red stained axial skeletons of control and exposed fish seen in column A, scale bar is 1 mm, and (C) vertebrae in insets from column B magnified, scale bar is 100 μm. Treatment groups are in rows: (1) Control, (2) 1.0% ERSE, (3) H1 scenario, (4) H1+0.1% ERSE co-exposure. Black arrowheads point to reduced intervertebral ligament spaces, and black arrows point to enlarged intervertebral ligament spaces.