
Fig. 3.
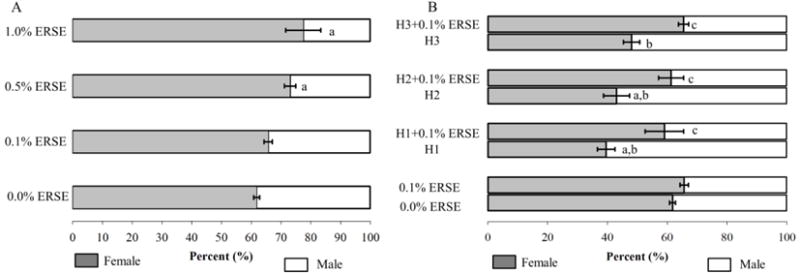
Sex ratios (as determined by secondary sex characteristics and confirmed by internal examination) of F0 adults exposed to ERSE and/or hypoxia as embryos. The sex ratios per treatment are reported as mean ± SEM (A: 0.0% (Control) n = 32, 0.1% n = 29, 0.5% n = 26, 1.0% n = 18; B: Normoxia (Control) n = 34, 0.1% n = 28, H1 n = 19, H2 n = 23, H3 n = 25, H1+0.1% n = 16, H2+0.1% n = 21, H3+0.1 n = 27 individuals). For panels A and B, controls are on the bottom. Grey bars represent females and white bars represent males. “a” indicates that there is a significant difference from control (p < 0.05); “b” indicates that there is a significant difference from 0.1% ERSE (p < 0.05); “c” indicates that there is a significant difference from H1 (p < 0.05).