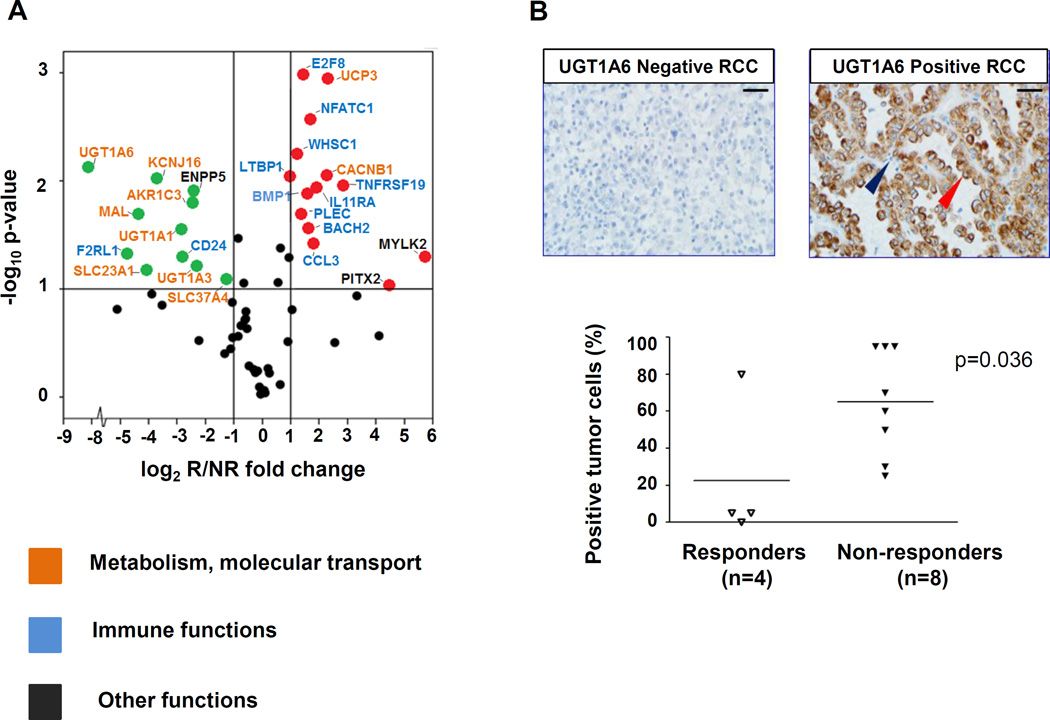
Figure 2. Genes overexpressed in pretreatment PD-L1+ RCC specimens from responding vs. nonresponding patients reflect immune vs. metabolic functions, respectively.
(A) Results of multiplex qRT-PCR for 60 select genes are shown, amplifying RNA isolated from pretreatment tumors in 4 responders and 8 nonresponders. Red and green dots represent genes significantly overexpressed or under-expressed, respectively, by at least 2-fold in tumors from responders compared to nonresponders, and with a 2-sided P value ≤ 0.1 (indicated by the horizontal line). Gene names are color-coded according to biological functions. The GUSB transcript was used as the internal reference. UGT1A6 was the most highly over-expressed gene associated with nonresponse to anti–PD-1. Similar results were obtained using 18S, ACTB, or PTPRC (CD45) as reference genes. Supporting information is provided in Table 2 and Supplementary Table S3. (B) UGT1A6 protein expression was evaluated by IHC in the same 12 pre-treatment PD-L1+ RCC specimens as were studied with qRT-PCR, including tumors from 4 responders and 8 nonresponders. In the top panels, representative UGT1A6 negative (left) and positive (right) RCC specimens are shown. Scale bars are equal to 25 um. Red arrow, kidney cancer cell with positive staining; blue arrow, infiltrating lymphocyte devoid of staining. In bottom panel, UGT1A6 expression is quantified by percent positive tumor cells in each specimen. Horizontal black bars indicate mean values. Enhanced UGT1A6 expression was significantly associated with nonresponse to anti–PD-1 therapy (P = 0.036, one-sided Wilcoxon rank sum test).

