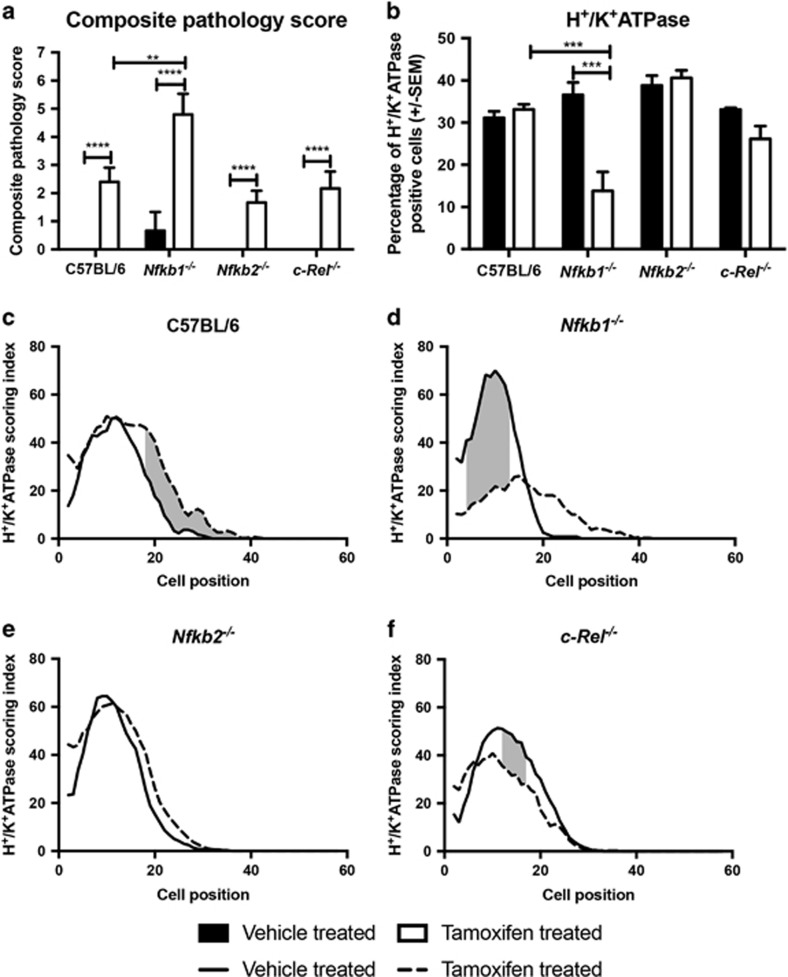
Figure 2.
Tamoxifen-induced epithelial lesions in WT, Nfkb1−/−, Nfkb2−/− and c-Rel−/− mice. (a) Visual analog scoring of pathology identified in hematoxylin and eosin-stained sections from mice treated with vehicle or 150 mg/kg tamoxifen. (b) Percentage of gastric corpus gland cells expressing H+/K+ATPase in mice treated with vehicle or 150 mg/kg tamoxifen. For panels (a and b), statistically significant differences tested by two-way ANOVA and Dunnett’s test. **P<0.01, ***P<0.001, ****P<0.0001. (c–f): H+/K+ATPase-positive cells plotted by cell position in the gastric corpus hemiglands of WT (c), Nfkb1−/− (d), Nfkb2−/−(e) and c-Rel−/−(f). Solid line represents distribution of cells in vehicle-treated mice, broken line tamoxifen-treated mice. Shaded area marks region of gland where distribution of H+/K+ATPase-positive cells differs significantly in tamoxifen-treated versus vehicle-treated mice, P<0.05 by modified median test. N=5 for all experimental groups

