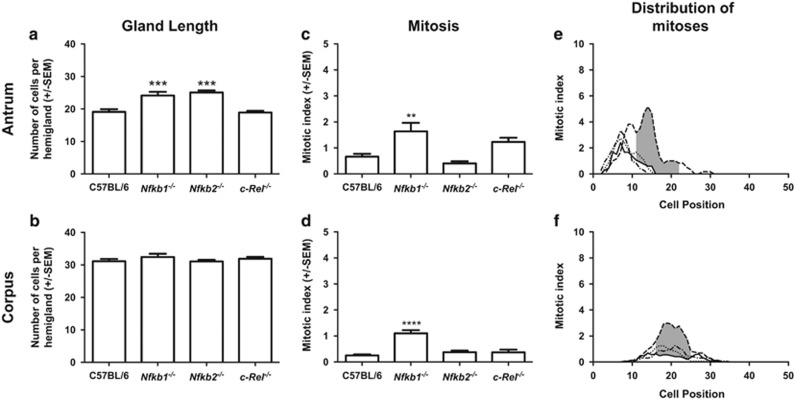
Figure 5.
Impact of NF-κB subunit deletion on gastric gland length (a and b), number of gastric epithelial cells undergoing mitosis (c and d) and location of mitoses within the gastric gland (e and f) of untreated mice. Panels (a, c and e) represent events in the gastric antral mucosa; panels (b, d and f) show data from the gastric corpus. Statistically significant differences tested by one-way ANOVA and Dunnett’s test (a–d), **P<0.01, ***P<0.001 ****P<0.0001. (e and f) Solid line represents distribution of mitotic cells in WT mice, dashed line Nfkb1−/−, dotted line Nfkb2−/−, dot and dash line c-Rel−/− mice. Shaded area marks region of gland where distribution of mitotic cells differs significantly in WT versus Nfkb1−/− mice, P<0.05 by modified median test. N=6 for all experimental groups

