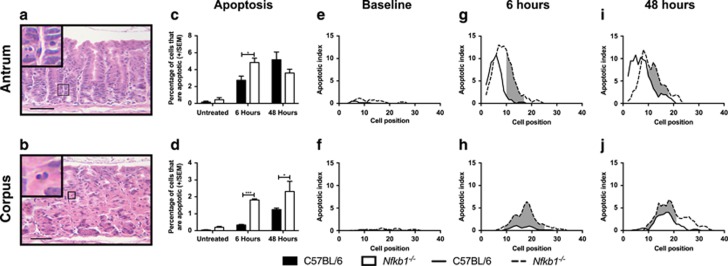
Figure 6.
Impact of NF-κB1 deletion on gastric epithelial apoptosis in untreated and 12 Gy γ-irradiated mice 6 and 48 h after irradiation. (a and b) Representative images of gastric corpus and antrum respectively stained with hematoxylin and eosin, arrows highlight apoptotic epithelial cells. Scale bars 100 μm. (c and d) Percentage of gastric epithelial cells undergoing apoptosis in gastric antrum and corpus, respectively. Statistically significant differences tested by two-way ANOVA and Dunnett’s test. *P<0.05, ***P<0.001. (e–j) Apoptotic cells plotted by cell position in the gastric antrum (e, g and i) and corpus (f, h and j) of untreated and irradiated WT and Nfkb1−/− mice. Solid lines represent distribution of cells in WT mice, broken lines Nfkb1−/− mice. Shaded areas mark regions of glands where distribution of apoptotic cells differs significantly in WT versus Nfkb1−/− mice, P<0.05 by modified median test. N=6 for all experimental groups

