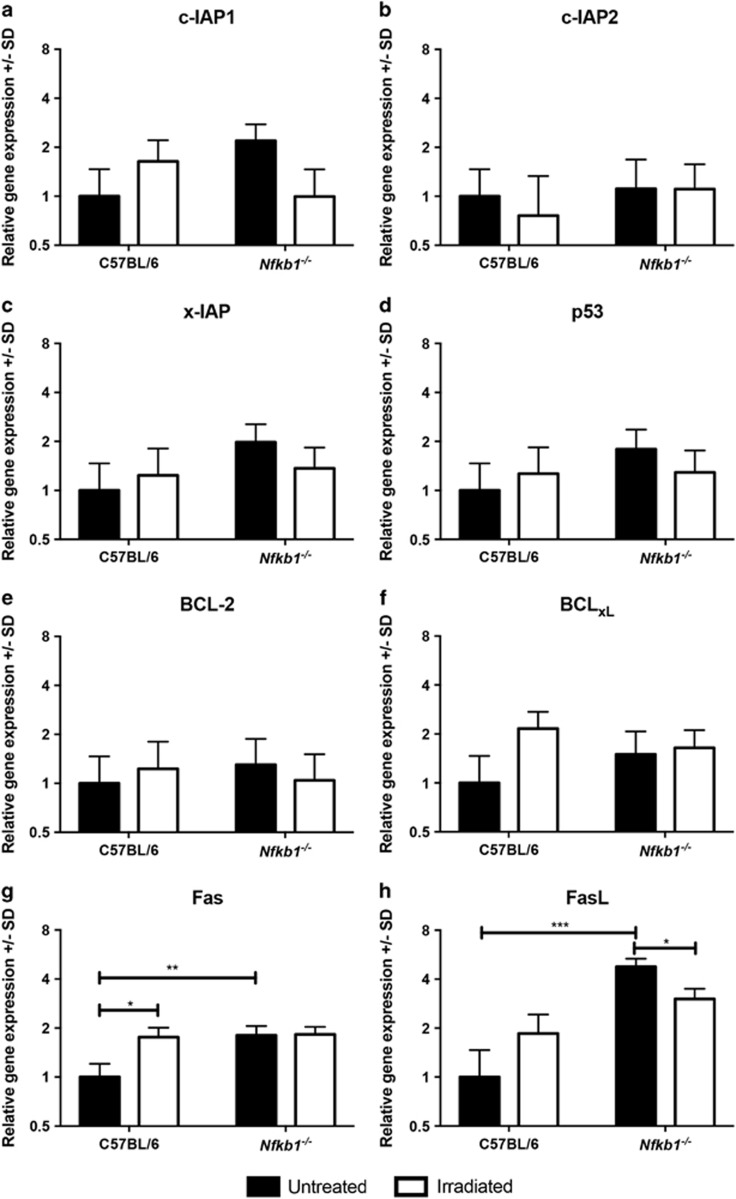
Figure 7.
Relative gene expression of specified regulators of apoptosis under transcriptional regulation of NF-κB signaling. Filled bars represent untreated mice, open bars animals culled 6 h after 12 Gy γ-irradiation. Mean and S.D of Log2-transformed relative abundance for each transcript are plotted. Statistically significant differences tested by two-way ANOVA and Dunnett’s test, *P<0.05, **P<0.01, ***P<0.001. N=3 for all experimental groups. Panels show expression of the following transcripts: (a) c-IAP!, (b) c-IAP2, (c) x-IAP, (d) p53, (e) BCL-2, (f) BCL-xL, (g) Fas, (h) FasL

