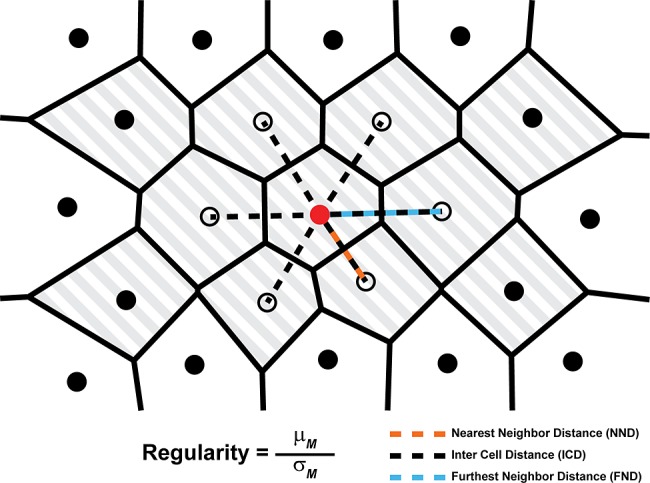
Figure 4.

A schematic of a hexagonally arranged patch of cones illustrating the relationship between the distance measurements used by Cooper et al.87 A single cone (red circle) and its six closest neighbors (open circles) are highlighted for clarity. The NND is defined as the distance from a given cone to its closest neighbor (orange dashed line). The FND is defined as the distance from each cone to its most distant neighbor (blue dashed line), and ICD is defined as the average distance between a cone and all of its neighbors (dashed lines). To mitigate boundary effects, only cones with bound Voronoi regions (shaded region) are included when calculating each metric. The regularity of each of these metrics (M) is defined as the mean (μM) of the metric for all cones with bounded Voronoi cells, divided by the metric's SD (σM). Reprinted from Cooper RF, Wilk MA, Tarima S, Carroll J. Evaluating descriptive metrics of the human cone mosaic. Invest Ophthalmol Vis Sci. 2016;57:2992–3001. Licensed under a Creative Commons Attribution-NonCommercial-NoDerivatives 4.0 International License.
