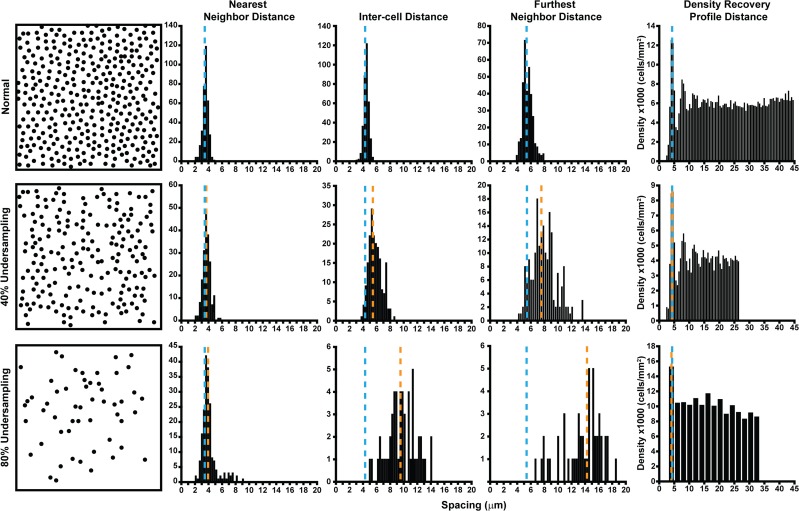
Figure 5.
Sensitivity and robustness of metrics in detecting cone loss. An illustration of the effect of cone undersampling on histograms of cell distances (NND, ICD, FND) and the DRPD from a single subject (JC_10145). A region of interest (37 × 37 μm sampling window) at 200 μm from the fovea was selected from confocal AOSLO, and cone coordinates were seminautomatically identified. For undersampled mosaics, 40% and 80% of the cone coordinates from the normal mosaic were removed by random distribution using the randperm MATLAB function of cone coordinate list. These mosaics are illustrated in the first column. In each plot, the blue dashed line is the mean of the histogram from the complete mosaic, while the orange dashed line is the mean of the histograms from the 40% (middle row) and the 80% undersampled mosaics (bottom row). On all plots, the y-axis is the number of cells within each histogram bin. The NND histogram is only marginally affected (indicated by the similarity in the blue and orange dashed lines), even with an 80% loss. Similarly, the DRPD is largely unaffected by cell loss; its estimated spacing is only affected when the bin size increases (bottom right) due to a decrease in density. In contrast, the mean (indicated by further separation of the blue and orange dashed lines) and spread of both ICD and FND increase substantially with cell loss. Reprinted from Cooper RF, Wilk MA, Tarima S, Carroll J. Evaluating descriptive metrics of the human cone mosaic. Invest Ophthalmol Vis Sci. 2016;57:2992–3001. Licensed under a Creative Commons Attribution-NonCommercial-NoDerivatives 4.0 International License.

