
Figure 1.
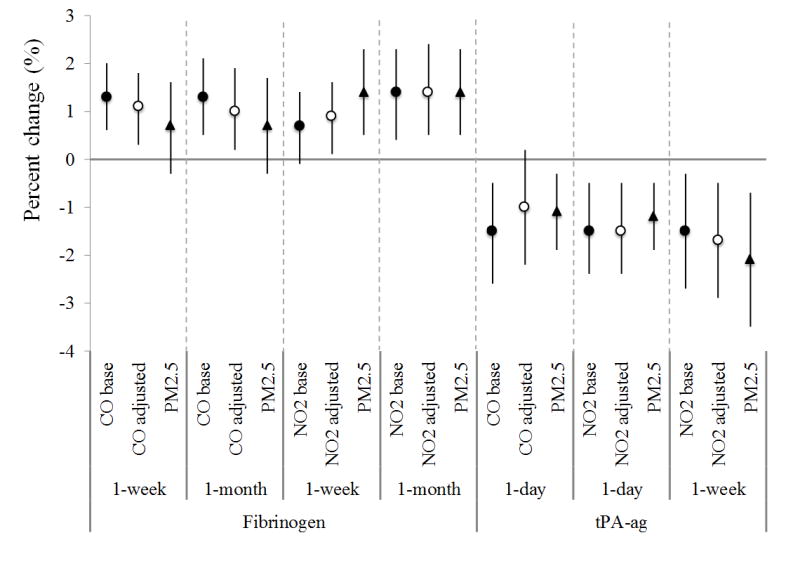
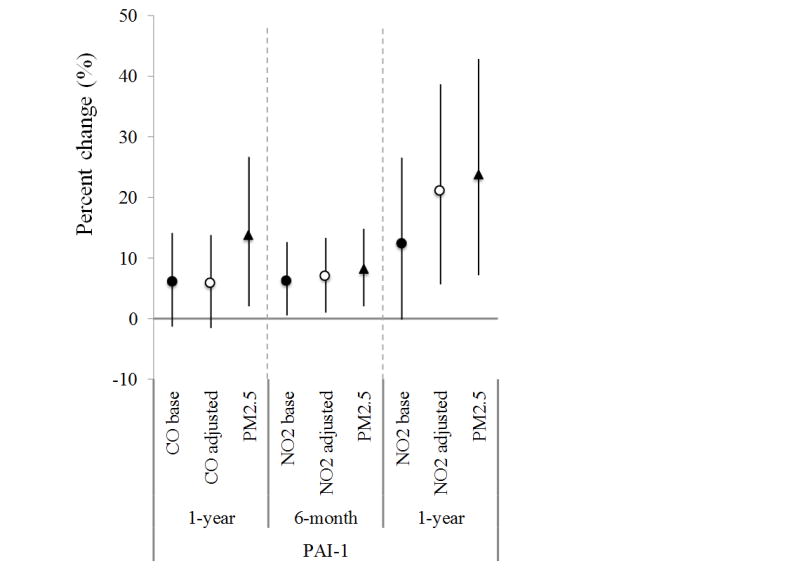
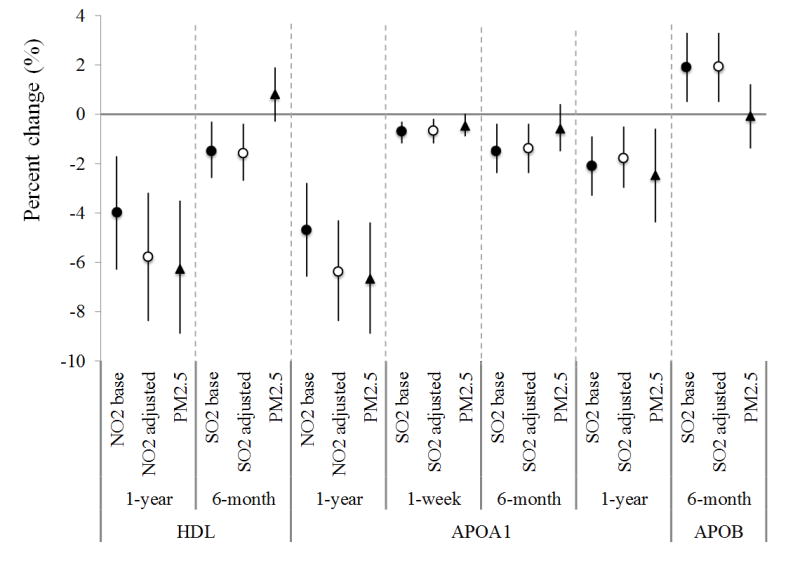
The association between gas exposure and selected CVD markers in selected exposure windows, before and after adjustment of PM2.5 exposure for SWAN cohort, 1999–2004. (Dots/circles/triangles are percent of change in the levels of markers per interquartile increase of exposure, and error bars are 95th% of confidence intervals. Dots - CO / NO2 / SO2 base – the change of the gas in the single-pollutant model with one gas only; circles - CO / NO2 / SO2 adj by PM – the change of the gas in the two-pollutant model with one gas and PM2.5; triangles - PM2.5 – the change of PM2.5 in two-pollutant model)