Figure 1.

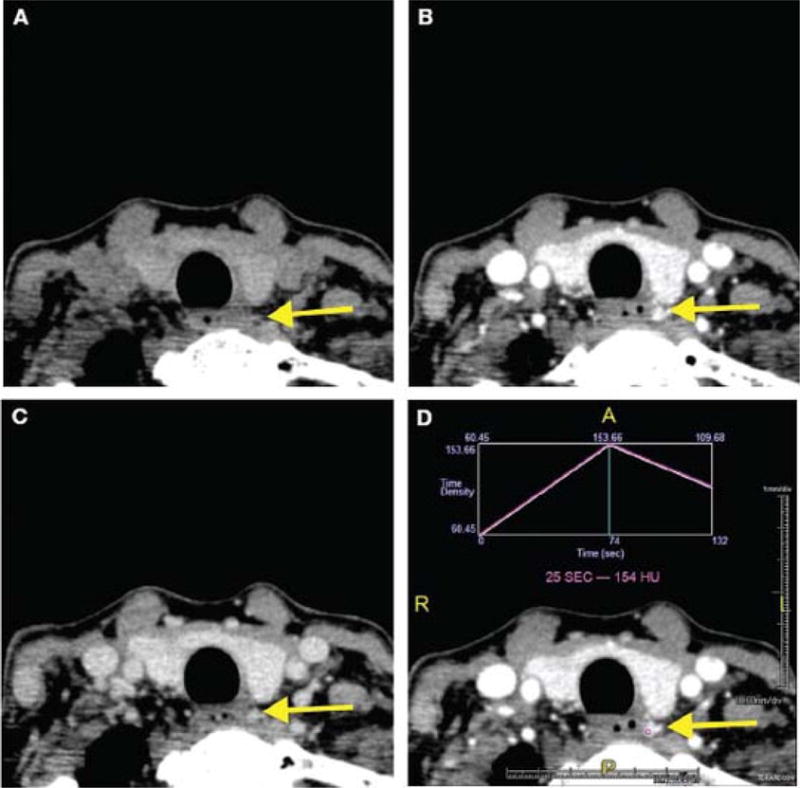
Single axial, 1-mm 4D-CT images show the precontrast phase (A), arterial phase (B), and delayed phase (C). Panel (D) shows a time-attenuation curve demonstrating rapid contrast enhancement and washout from the adenomatous gland.

Single axial, 1-mm 4D-CT images show the precontrast phase (A), arterial phase (B), and delayed phase (C). Panel (D) shows a time-attenuation curve demonstrating rapid contrast enhancement and washout from the adenomatous gland.