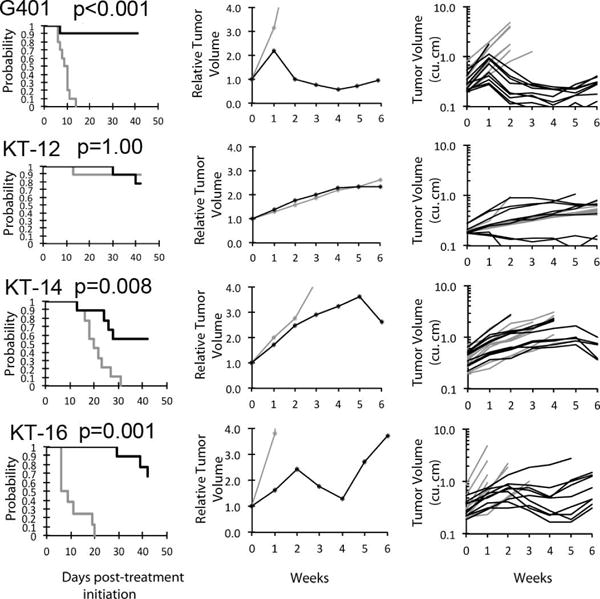
Figure 1.

Tazemetostat (EPZ-6438) in vivo objective response activity kidney rhabdoid tumor models. A. Kaplan-Meier curves with statistical significance indicated by p-values for EFS of the control (gray) and treated (black) groups. B, median relative tumor volume graphs (center), and C. individual tumor volume graphs (right) are shown for selected lines.
