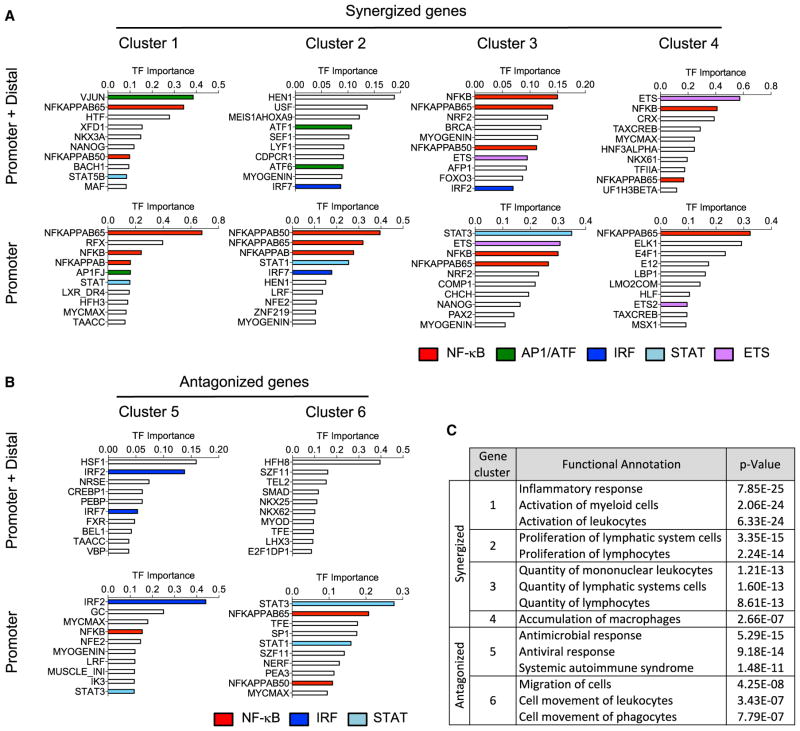
Figure 3. Transcription Factor Motif and Pathway Analysis of TLR Non-additive Response Genes.
(A and B) DiRE analysis of enriched transcriptional regulatory motifs at the promoter and promoter + distal regions of (A) synergized and (B) antagonized gene clusters as identified in Figure 2B. Members of recurrent NF-kB, AP1, IRF, STAT, and ETS transcription factor families are highlighted.
(C) Ingenuity pathway analysis (IPA) functional annotation of genes within the synergized and antagonized gene clusters as identified in Figure 2B.

