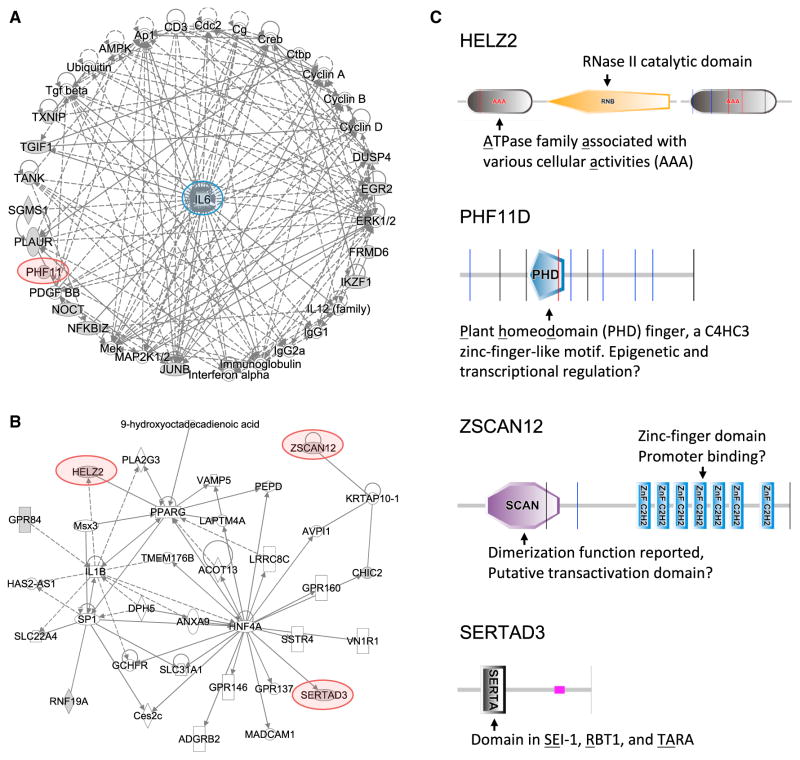
Figure 6. Pathway Analysis of Network Interactions among Screen Hits.
(A and B) Network analysis of screen hits using IPA identifies (A) a network of hits with direct and indirect associations with IL-6 regulation, and (B) an interconnected network around the transcriptional regulators PPARG, SP1, and HNF4A. Screen hits are indicated by gray shading, genes connected to the hits are white. Hits selected for follow up are highlighted. Arrows indicate a known functional link between the genes.
(C) Protein domain analysis of the screen hits HELZ2, PHF11D, ZSCAN12, and SERTAD3, conducted using SMART (http://smart.embl-heidelberg.de).

