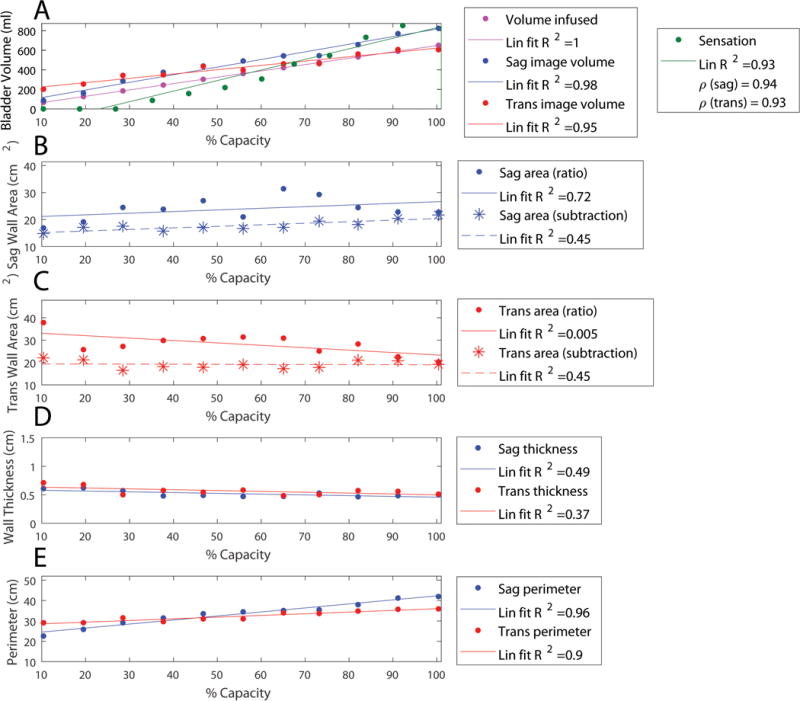
Figure 5.

Geometric results from a representative individual based on analysis of ultrasound images with lines of best fit. Legends include R-squared value of the linear fit (Lin fit R2). A) The volume infused is shown in magenta, sagittal-image based volume is shown in blue, and transverse-image based volume is shown in red. Sensation is overlaid in green with correlation coefficient (ρ) between image based volumes and sensation shown in the legend. B) Sagittal wall area (Sag area) is shown as estimated by the ratio method (equation 5, dots with solid line fit) and subtraction method (equation 4, stars with dashed line fit). C) Transverse wall area (Trans area) is shown as estimated by the ratio method (dots with solid line fit) and subtraction method (stars with dashed line fit). D) Using the wall areas estimated by the subtraction method, the sagittal wall thickness is shown in blue and the transverse wall thickness in red. E) The inner bladder wall perimeter in the sagittal (blue) and transverse (red) planes is shown.
