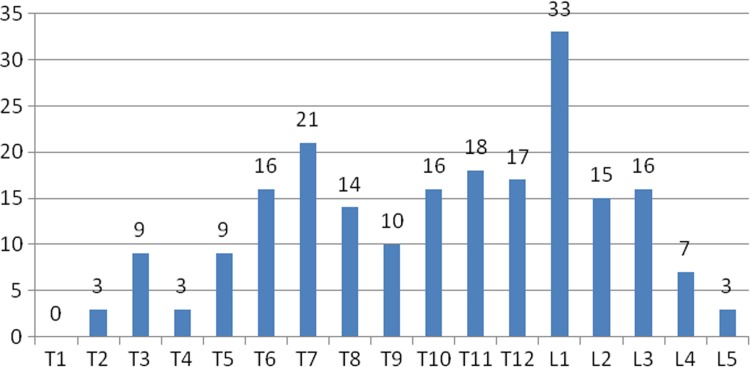
Figure 6:
The distribution of vertebrae in the thoracic and lumbar spine with compression fracture deformities. This graph is annotated in standard anatomic fashion, with T1 indicating the first thoracic vertebra, L1 indicating the first lumbar vertebra, and so on. At the top of each bar is the number of compression fractures at that anatomic level in the case set. The expected bimodal distribution of the frequency of fractures is seen, with a peak in the midthoracic spine (at T7 here) and a peak in the upper lumbar spine (at L1).

