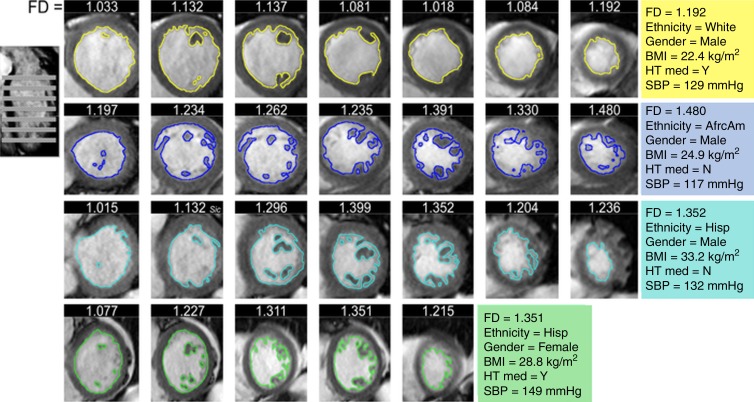
Figure 2:
Analysis of MR images of FD. FD was measured via fractal analysis of short-axis cine steady-state free precession images in four exemplar subjects from the MESA cohort: one subject with low FD (top) and three subjects with high FD (rows 2, 3, and 4). Colored lines show contouring of endocardial borders. FD indicates how extensively the contour fills two-dimensional space. The image on the left shows planning of the short-axis cine stack. Numbers on top of each short-axis image indicate the FD of the respective section. Colored panels on the right give characteristics of the four subjects. AfrcAm = African American, BMI = body mass index, Hisp = Hispanic, HT med = hypertension medication, N = no, SBP = systolic blood pressure, Y = yes.

