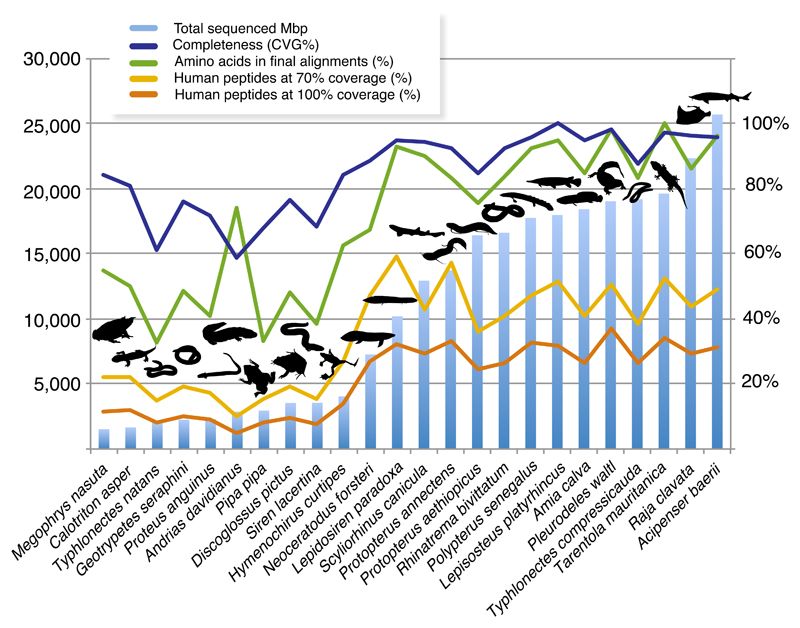
Figure 1.
Transcriptome sequencing effort and performance in phylogenomic dataset assembly. Histogram represent sequencing effort as total number of sequenced (clean) Mbp (million bp). Transcriptome completeness is measured as the proportion of recovered core vertebrate genes (233 CVG; Hara et al.29). Genes effectively usable for phylogenomics are approximated by the proportion of human proteins reconstructed at full (100%) and nearly full (>70%) lengths (in proportion to a total of 22,964 human genes). The completeness the relevant species in our final phylogenomic dataset is shown as the proportion of amino acids across all 7,189 genes (3,791,500 aligned amino acids in total).

