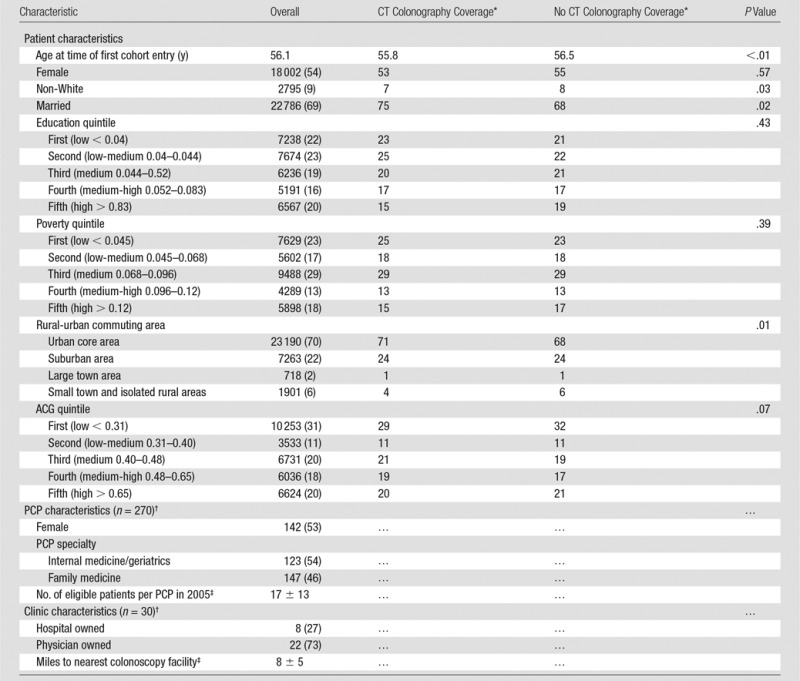
Table 1.
Patient, PCP, and Clinic Characteristics

Note.— Unless otherwise indicated, data are the number of patients and numbers in parentheses are percentages. ACG = Johns Hopkins ACG healthcare utilization score.
*Values are adjusted for propensity score categories.
†PCPs and clinics treat patients with and patients without CT colonography coverage; therefore, their characteristics do not differ, and they are not presented separately.
‡Data are mean ± standard deviation.
